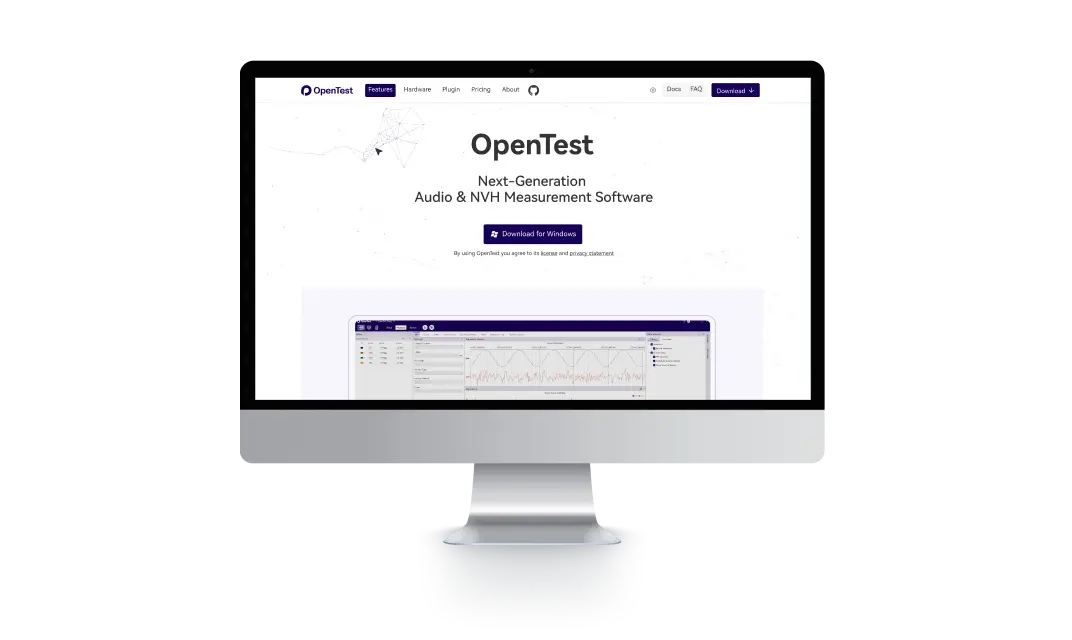
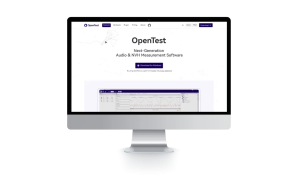
OpenTest is a next-generation platform designed for engineers, researchers, and manufacturers seeking precision, flexibility, and innovation in acoustic and vibration testing. Built on three core principles—Openness, AI-Driven Intelligence, and Boundless Compatibility—we empower industries like consumer electronics, automotive NVH, industrial diagnostics, and academic research to redefine quality control, accelerate R&D, and streamline production.

OpenTest

$999.00

Free Shipping

24x7 Customer Service
30-Day Return
2-Year Worry-Free Warranty
One-on One Expert Support

Payment Methods

Express Delivery

NEW

OpenTest

$999.00

OpenTest is a next-generation platform designed for engineers, researchers, and manufacturers seeking precision, flexibility, and innovation in acoustic and vibration testing. Built on three core principles-Openness, AI-Driven Intelligence, and Boundless Compatibility-we empower industries like consumer electronics, automotive NVH, industrial diagnostics, and academic research to redefine quality control, accelerate R&D, and streamline production.

Product Highlights
Open Hardware

Open Hardware

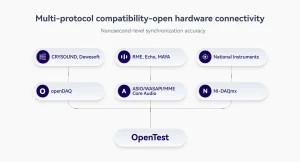
OpenTest supports data acquisition devices to connect via mainstream audio protocols such as openDAQ, ASIO, WASAPI, and Core Audio. It also supports connections through private protocols like NI-DAQmx.

openDAQ

ASIO

WASAPI

Core Audio

Open Hardware
Open Plugin

Open Plugin

Engineer beyond limits — OpenTest's modular plugin architecture empowers you to extend system capabilities by building custom data acquisition logic, AI-powered analysis (e.g., noise anomaly detection), and domain-specific dashboards. Seamless SDK integration with LabVIEW, Matlab, and Python ecosystems accelerates development while maintaining enterprise-grade security.

Theme Plugin

Algorithm Plugin

Application Plugin

Open Plugin
Open Source

Open Source

Full-stack Open Source
Join a global developer community. Modify, optimize, and share code for acoustic/vibration testing algorithms.
Free Core Features
Access essential tools like frequency response, phase analysis, and distortion testing—completely free for students, startups, and researchers.
Open Source
Monitor

Monitor

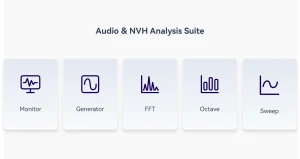
Continuous waveform monitoring and FFT spectrum analysis enable real-time identification of signal anomalies, such as clipping, clock jitter, and other issues. It simultaneously tracks key metrics, including RMS level, THD, SND, and frequency response, with configurable high-pass/low-pass filters and A/C/Z frequency weighting.

Dynamic Tracking

Instant Anomaly Detection

Monitor
Octave Analysis

Octave Analysis

The octave analysis function provides two core tools: FFT-based fast analysis and filter-based standard analysis. Within a set recording period, the system can simultaneously perform multi-channel analysis with different octave widths on the acquired waveform, flexibly adapting to diverse testing scenarios. Users can customize the frequency range according to their needs, apply A/C/Z frequency weightings, and conduct synchronous analysis of multiple octave types including 1/1oct., 1/3oct., 1/6oct., 1/12oct., and 1/24oct. The analysis results can be intuitively presented in three forms: bar charts, line charts, and tables, facilitating data interpretation and storage.

Real-time Analysis

Octave Analysis
Sweep Analysis

Sweep Analysis

The sweep analysis function offers two core modes: continuous sweep and stepped sweep, enabling dynamic sweep testing of signals within a set frequency range. The system can automatically generate sweep signals based on preset parameters (such as sweep rate or step interval), synchronously collect response data from the measured object, and calculate and display key indicators in real time—including amplitude-frequency characteristics and phase-frequency characteristics. It also supports multi-channel parallel testing, effectively adapting to multi-dimensional testing scenarios.

Full-range Rapid Measurement

Sweep Analysis
Sound Power Testing

Sound Power Testing

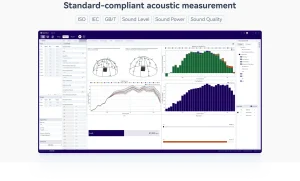
This solution supports sound pressure-based sound power measurement, fully compliant with international standards ISO 3744 (Engineering Method), ISO 3745 (Precision Method), and ISO 3746 (Survey Method), meeting various accuracy requirements in different scenarios. It is suitable for R&D and quality control in consumer electronics, automotive audio systems, and professional audio equipment.


Flexible Modular Design

Precise Quantification of Acoustic Performance

Sound Power Testing
Technical Specifications
Mode
Measure Mode, Analysis Mode, Sequence Mode
Monitor
Scope, FFT Spectrum, Spectrogram,RMS Level, DC Level, Peak Level, THD Ratio, THD+N Ratio, Crosstalk, etc.
Measure
FFT Analysis, Octave Analysis, Continuous Sweep, Stepped Frequency Sweep, Sound Power Testing, Sound Level Meter, Sound Quality, etc.
Report
General report, Sound power test report in compliance with international standards
CPU
Inter i3-13100 or better
RAM
16GB or better
Resolution
1920*1080 or better
Supported operation system
Windows 11(64bit)
Device driver
vcredist_x86_2010

CRYSOUND POCKET

Acoustic Imaging Camera

Visualize Sound. Stop Leaks. Prevent Downtime.
Professional tool in your pocket.

CRYSOUND POCKET Acoustic Imaging Camera

One-tap photo/video/audio recording with 32 GB internal storage makes documentation effortless. Create a built-in WLAN hotspot to preview/download/share results on site via the Acoustic Link mobile app, then import via Wi-Fi or USB-C to add notes/tags and generate standardized inspection reports on mobile phone or PC.
Main Features

Related Products

A²B Microphone Testing: A Practical Measurement Setup and Workflow

As A²B microphones and sensors are increasingly adopted in automotive applications, the demand for reliable testing in both R&D and production is also growing. This article explains why A²B testing matters, highlights the advantages of A²B over traditional analog cabling in terms of interconnect and scalability, outlines key measurement KPIs (such as frequency response, THD+N, phase/polarity, and SNR), and presents a typical test-bench setup along with the corresponding solution configuration. Why A²B Microphone and Sensor Testing Matters In-cabin audio is no longer just "music playback". Modern vehicles depend on high-performance acoustic sensing for hands-free calling, in-cabin communication, voice assistants, ANC/RNC, and more—and these features increasingly rely on multiple microphones and even accelerometers deployed around the cabin. ADI notes that the rapid expansion of audio-, voice-, and acoustics-related applications is a key trend, and that new digital microphone and connectivity approaches are enabling broader adoption. To deliver consistent performance, teams need a test workflow that is repeatable across different node positions, harness lengths, and configurations—without turning every debug session into a custom project. The Interconnect Shift: From Shielded Analog Cables to Digital A²B Historically, scaling microphone counts often meant scaling shielded analog cabling, which adds weight, cost, and integration burden—sometimes limiting these features to premium vehicle segments. A²B (Automotive Audio Bus) addresses that interconnect problem by enabling a scalable, networked digital audio architecture with deterministic behavior—exactly what timing-sensitive acoustic applications need. Figures a and b show how such a design may be realized with the traditional analog and the digital A²B systems, respectively. Figure 1 (a) Analog system design with analog mic elements (shielded wires). (b) Digital system design with digital mic elements (A²B technology and UTP wires). What You'll Measure: Key A²B Microphone KPIs Frequency Response (FR) THD+N Phase / polarity (and channel-to-channel consistency for arrays) SNR AOP (if required by your program/spec) Typical Block Diagram-What the Bench Looks Like At CRYSOUND, we provide more than just the CRY580 A²B interface. We offer a full automotive audio testing solution, including audio acquisition cards, microphones and sensors, acoustic sources, custom fixtures, acoustic test boxes, and vibration shakers, delivering a complete and streamlined testing experience. Figure 2 Here's a description of the testing block diagram, including the use of the latest OpenTest Audio Test & Measurement Software https://opentest.com Solution BOM List The value of end-to-end delivery: reducing system integration time and minimizing coordination costs between multiple suppliers. We cover everything from R&D to production line testing. Figure 3 BOM list of the solution If you'd like to learn more about A²B testing, please fill out the Get in touch form below and we'll reach out shoutly.

Abnormal Noise Detection: From Human Ears to AI

With the rapid growth of consumer audio products such as headphones, loudspeakers and wearables, users’ expectations for “good sound” have moved far beyond simply being able to hear clearly. Now they want sound that is comfortable, clean, and free from any extra rustling, clicking or scratching noises. However, in most factories, abnormal noise testing still relies heavily on human listening. Shift schedules, subjective differences between operators, fatigue and emotional state all directly impact your yield rate and brand reputation. In this article, based on CRYSOUND’s real project experience with AI listening inspection for TWS earbuds, we’ll talk about how to use AI to “free human ears” from the production line and make listening tests truly stable, efficient and repeatable. Why Is Audio Listening Test So Labor-Intensive? In traditional setups, the production line usually follows this pattern: automatic electro-acoustic test + manual listening recheck. The pain points of manual listening are very clear: Strong subjectivity: Different listeners have different sensitivity to noises such as “rustling” or “scratching”. Even the same person may judge inconsistently between morning and night shifts. Poor scalability: Human listening requires intense concentration, and it’s easy to become fatigued over long periods. It’s hard to support high UPH in mass production. High training cost: A qualified listener needs systematic training and long-term experience accumulation, and it takes time for new operators to get up to speed. Results hard to trace: Subjective judgments are difficult to turn into quantitative data and history, which makes later quality analysis and improvement more challenging. That’s why the industry has long been looking for a way to use automation and algorithms to handle this work more stably and economically—without sacrificing the sensitivity of the “human ear.” From “Human Ears” to “AI Ears”: CRYSOUND’s Overall Approach CRYSOUND’s answer is a standardized test platform built around the CRYSOUND abnormal noise test system, combined with AI listening algorithms and dedicated fixtures to form a complete, integrated hardware–software solution. Key Characteristics of the Solution: Standardized, multi-purpose platform: Modular design that supports both conventional SPK audio / noise tests and abnormal noise / AI listening tests. 1-to-2 parallel testing: A single system can test two earbuds at the same time. In typical projects, UPH can reach about 120 pcs. AI listening analysis module: By collecting good-unit data to build a model, the system automatically identifies units with abnormal noise, significantly reducing manual listening stations. Low-noise test environment: A high-performance acoustic chamber plus an inner-box structure control the background noise to around 12 dBA, providing a stable acoustic environment for the AI algorithm. In simple terms, the solution is: One standardized test bench + one dedicated fixture + one AI listening algorithm. Typical Test Signal Path Centered on the test host, the “lab + production line” unified chain looks like this: PC host → CRY576 Bluetooth Adapter → TWS earphones Earphones output sound, captured by CRY718-S01 Ear Simulator Signal is acquired and analyzed by the CRY6151B Electroacoustic Analyzer The software calls the AI listening algorithm module, performs automatic analysis on the WAV data and outputs a PASS/FAIL result Fixtures and Acoustic Chamber: Minimizing Station-to-Station Variation Product placement posture and coupling conditions often determine test consistency. The solution reduces test variation through fixture and chamber design to fix the test conditions as much as possible: Fixture: Soft rubber shaped recess. The shaped recess ensures that the earbud is always placed against the artificial ear in the same posture, reducing position errors and test variation. The soft rubber improves sealing and prevents mechanical damage to the earphones. Acoustic box: Inner-box damping and acoustic isolation. This reduces the impact of external mechanical vibration and environmental noise on the measurement results. Professional-Grade Acoustic Hardware (Example Configuration) CRY6151B Electroacoustic Analyzer Frequency range 20–20 kHz, low background noise and high dynamic range, integrating both signal output and measurement input. CRY718-S01 Ear Simulator Set Meets relevant IEC / ITU requirements. Under appropriate configurations / conditions, the system’s own noise can reach the 12 dBA level. CRY725D Shielded Acoustic Chamber Integrates RF shielding and acoustic isolation, tailored for TWS test scenarios. AI Algorithm: How Unsupervised Anomaly Detection “Recognizes the Abnormal” Training Flow: Only “Good” Earphones Are Needed CRYSOUND’s AI listening solution uses an unsupervised anomalous sound detection algorithm. Its biggest advantage is that it does not require collecting many abnormal samples in advance—only normal, good units are needed to train a model that “understands good sound”. In real projects, the typical steps are as follows: Prepare no fewer than 100 good units. Under the same conditions as mass production testing, collect WAV data from these 100 units. Train the model using these good-unit data (for example, 100 samples of 10 seconds each; training usually takes less than 1 minute). Use the model to test both good and defective samples, compare the distribution of the results, and set the decision threshold. After training, the model can be used directly in mass production. Prediction time for a single sample is under 0.5 seconds. In this process, engineers do not need to manually label each type of abnormal noise, which greatly lowers the barrier to introducing the system into a new project. Principle in Brief: Let the Model “Retell” a Normal Sound First Roughly speaking, the algorithm works in three steps: Time-frequency conversion Convert the recorded waveform into a time-frequency spectrogram (like a “picture of the sound”). Deep-learning-based reconstruction Use the deep learning model trained on “normal earphones” to reconstruct the time-frequency spectrogram. For normal samples, the model can more or less “reproduce” the original spectrogram. For samples containing abnormal noise, the abnormal parts are difficult to reconstruct. Difference analysis Compare the original spectrogram with the reconstructed one and calculate the difference along the time and frequency axes to obtain two difference curves. Abnormal samples will show prominent peaks or concentrated energy areas on these curves. In this way, the algorithm develops a strong fit to the “normal” pattern and becomes naturally sensitive to any deviation from that pattern, without needing to build a separate model for each type of abnormal noise. In actual projects, this algorithm has already been verified in more than 10 different projects, achieving a defect detection rate of up to 99.9%. Practical Advantages of AI Listening No dependence on abnormal samples: No need to spend enormous effort collecting various “scratching” or “electrical” noise examples. Adapts to new abnormalities: Even if a new type of abnormal sound appears that was not present during training, as long as it is significantly different from the normal pattern, the algorithm can still detect it. Continuous learning: New good-unit data can be continuously added later so that the model can adapt to small drifts in the line and environment over the long term. Greatly reduced manual workload: Instead of “everyone listening,” you move to “AI scanning + small-batch sampling inspection,” freeing people to focus on higher-value analysis and optimization work. A Typical Deployment Case: Real-World Practice on an ODM TWS Production Line On one ODM’s TWS production line, the daily output per line is on the order of thousands of sets. In order to improve yield and reduce the burden of manual listening, they introduced the AI abnormal-noise test solution: ItemBefore Introducing the AI Abnormal-Noise Test SolutionAfter Introducing the AI Abnormal-Noise Test SolutionTest method4 manual listening stations, abnormal noises judged purely by human listeners4 AI listening test systems, each testing one pair of earbudsManpower configuration4 operators (full-time listening)2 operators (for loading/unloading + rechecking abnormal units)Quality riskMissed defects and escapes due to subjectivity and fatigueDuring pilot runs, AI system results matched manual sampling; stability improved significantlyWork during pilot stageDefine manual listening proceduresCollect samples, train the AI model, set thresholds, and validate feasibility via manual samplingDaily line capacity (per line)Limited by the pace of manual testingAbout 1,000 pairs of earbuds per dayAbnormal-noise detection rateMissed defects existed, not quantified≈ 99.9%False-fail rate (good units misjudged)Affected by subjectivity and fatigue, not quantified≈ 0.2% On this line, AI listening has essentially taken over the original manual listening tasks. Not only has the headcount been cut by half, but the risk of missed defects has been significantly reduced, providing data support for scaling the solution across more production lines in the future. Deployment Recommendations: How to Get the Most Out of This Solution If you are considering introducing AI-based abnormal-noise testing, you can start from the following aspects: Plan sample collection as early as possible Begin accumulating“confirmed no abnormal-noise”good-unit waveforms during the trial build /small pilot stage, so you can get a head start on AI training later. Minimize environmental interference The AI listening test station should be placed away from high-noise equipment such as dispensing machines and soldering machines. By turning off alarm buzzers, defining material-handling aisles that avoid the test stations, and reducing floor vibration, you can effectively lower false-detection rates. Keep test conditions consistent Use the same isolation chamber, artificial ear, fixtures and test sequence in both the training and mass-production phases, to avoid model transfer issues caused by environmental differences. Maintain a period of human–machine coexistence In the early stage, you can adopt a“100% AI + manual sampling”strategy, and then gradually transition to“100% AI + a small amount of DOA recheck,”in order to minimize the risks associated with deployment. Conclusion: Let Testing Return to “Looking at Data” and Put People Where They Create More Value AI listening tests, at their core, are an industrial upgrade—from experience-based human listening to data- and algorithm-driven testing. With standardized CRYSOUND test platforms, professional acoustic hardware, product-specific fixtures and AI algorithms, CRYSOUND is helping more and more customers transform time-consuming, labor-intensive and subjective manual listening into something stable, quantifiable and reusable. If you’d like to learn more about abnormal-noise testing for earphones, or planning to try AI listening on your next-generation production line—or discuss your blade process and inspection targets—please use the “Get in touch” form below. Our team can share recommended settings and an on-site workflow tailored to your production conditions.
Acoustic Camera for Sound Source Localization

Acoustic Camera: The Complete Guide to Sound Source Localization

An acoustic camera is one of the most powerful tools available to engineers who need to locate, visualize, and quantify noise sources in complex environments. Whether you are troubleshooting an unwanted rattle inside a vehicle cabin, tracking down air leaks in a compressed-air system, or verifying the acoustic performance of a home appliance on the production line, an acoustic camera can do in minutes what traditional measurement methods take hours—or fail to do at all. This complete guide explains how acoustic cameras work, where they are used, what to look for when choosing one, and how they compare to conventional sound level meters. By the end, you will have a clear understanding of sound source localization technology and the confidence to select the right acoustic imaging camera for your application. What Is an Acoustic Camera? An acoustic camera is an instrument that combines a microphone array with a digital camera to produce a real-time visual map of sound—often called an acoustic image or sound map. The colored overlay shows exactly where noise is coming from, its relative intensity, and how it changes over time or frequency. Unlike a single microphone, which can measure sound pressure at one point but cannot tell you where the sound originates, an acoustic camera performs noise source identification across a wide field of view simultaneously. Core Components Component Role Microphone array Captures sound at multiple spatial positions Digital camera Provides the optical reference image Data acquisition hardware Digitizes and synchronizes all microphone channels Beamforming software Computes the sound map from array data How Does an Acoustic Camera Work? The Beamforming Principle The physics behind an acoustic camera relies on a technique called beamforming. Here is a simplified explanation: Sound waves arrive at the microphone array. Because microphones are at different positions, the same wavefront reaches each microphone at a slightly different time. Time delays are calculated. For every candidate point in the measurement space, the software calculates the expected arrival-time differences across all microphones. Signals are shifted and summed. The software shifts each microphone signal by the predicted delay and sums them. If the candidate point is the true source, the signals add constructively, producing a strong peak. If not, they partially cancel. A sound map is generated. By scanning thousands of candidate points, the algorithm builds a 2D (or 3D) color map of acoustic intensity overlaid on the camera image. This process is called delay-and-sum beamforming and is the foundation of most acoustic cameras. More advanced algorithms—such as CLEAN-SC, functional beamforming, and deconvolution approaches—further sharpen the image and improve dynamic range. Frequency Range and Array Design The usable frequency range of an acoustic camera depends on the array geometry: Low-frequency limit is governed by the overall array diameter. A larger array resolves lower frequencies. High-frequency limit is governed by the spacing between adjacent microphones. Closer spacing avoids spatial aliasing at higher frequencies. Typical acoustic cameras cover 200 Hz to 12 kHz or wider, with some specialized arrays reaching above 20 kHz for applications like leak detection. Applications of Acoustic Cameras Automotive NVH (Noise, Vibration, and Harshness) Acoustic cameras are indispensable in automotive development. Engineers use them to: Identify wind noise sources around door seals, mirrors, and A-pillars in wind-tunnel tests. Locate interior noise paths—dashboard rattles, HVAC duct noise, powertrain radiation—during road tests. Validate pass-by noise levels under ISO 362 by mapping exterior noise sources in real time. Home Appliance Noise Reduction Consumer expectations for quiet appliances are rising. Manufacturers of washing machines, refrigerators, dishwashers, and air conditioners use acoustic cameras to: Compare noise signatures before and after design changes. Detect abnormal noise patterns in end-of-line (EOL) quality checks. Pinpoint noise from specific subcomponents (compressors, fans, pumps) within a fully assembled product. Industrial Equipment and Predictive Maintenance In factories, acoustic cameras quickly identify: Compressed-air leaks, which account for 20–30% of energy waste in many plants. Bearing defects in motors, turbines, and conveyors—often before they become audible to the human ear. Electrical discharge (partial discharge) in high-voltage switchgear and transformers. Building Acoustics and Environmental Noise Acoustic cameras help building consultants identify sound transmission paths through walls, windows, and HVAC penetrations, verify the effectiveness of sound barriers, and map noise from construction sites. Power Generation and Renewable Energy Wind turbine manufacturers and operators use acoustic cameras to measure blade noise, detect trailing-edge damage, and comply with environmental noise limits. How to Choose an Acoustic Camera 1. Array Configuration and Size Planar arrays (flat) are the most common—lightweight, portable, and suitable for front-facing measurements. Spherical or 3D arrays capture sound from all directions for interior cabin or room acoustic studies. Number of microphones: More microphones improve spatial resolution and dynamic range. Entry-level: 30–64; high-performance: 100–200+. 2. Frequency Range Application Typical Frequency Range Automotive NVH (interior) 200 Hz – 8 kHz Appliance noise 300 Hz – 12 kHz Air leak detection 2 kHz – 20 kHz+ Building acoustics 100 Hz – 5 kHz 3. Software Capabilities Real-time beamforming, advanced algorithms (CLEAN-SC, deconvolution), time-domain and frequency-domain analysis, video recording with synchronized audio, and flexible export formats. 4. Portability and Ease of Use For field measurements, a lightweight, battery-powered, single-person-operable system is essential. A Closer Look: CRYSOUND Acoustic Imaging Systems The CRY8124 is a large-format planar array with 200 MEMS microphones, optimized for high-resolution measurements in automotive NVH and industrial applications. The CRY2623 is a compact, handheld acoustic camera with 128 microphones designed for rapid field inspections—air leak detection, electrical inspection, and predictive maintenance. Both systems include real-time beamforming software with CLEAN-SC deconvolution, video overlay, and spectral analysis. Acoustic Camera vs. Sound Level Meter: When to Use Which Criterion Sound Level Meter Acoustic Camera What it measures Sound pressure level at one point Sound source location and relative level across a surface Source identification No Yes—visual map shows source locations Regulatory compliance Yes—traceable dB(A)/dB(C) values per IEC 61672 Limited Cost $500–$5,000 $15,000–$150,000+ Best for SPL measurement, noise monitoring, compliance Root-cause analysis, noise reduction, leak detection In practice, the two tools are complementary. A sound level meter confirms how loud a problem is; an acoustic camera shows where it is. Conclusion Acoustic cameras have transformed the way engineers approach noise problems. By making sound visible, they accelerate root-cause analysis, reduce development cycles, and enable quality controls that were previously impractical. Ready to see your noise sources? Contact CRYSOUND for a personalized consultation or request a live demo with your application.

Get in touch

If you are interested or have questions about our products, book a demo and we will be glad to show how it works, which solutions it can take part of and discuss how it might fit your needs and organization.

Shipping calculated at checkout
$999.00
Support Support
Product Catalogs Product Catalogs Solutions Solutions User Manuals User Manuals Software Download Software Download Product Inquiry Product Inquiry Schedule Demo Schedule Demo Technical Support Technical Support +86-571-88225128 +86-571-88225128
Request Quote 0
Request Quote
This site is registered on wpml.org as a development site. Switch to a production site key to remove this banner.