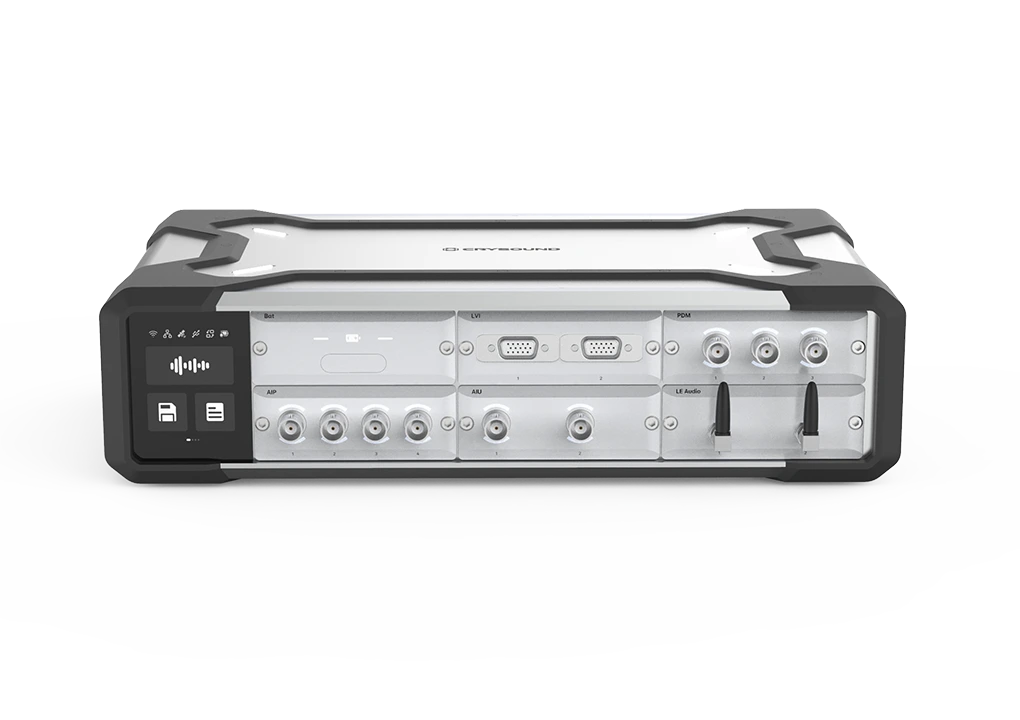
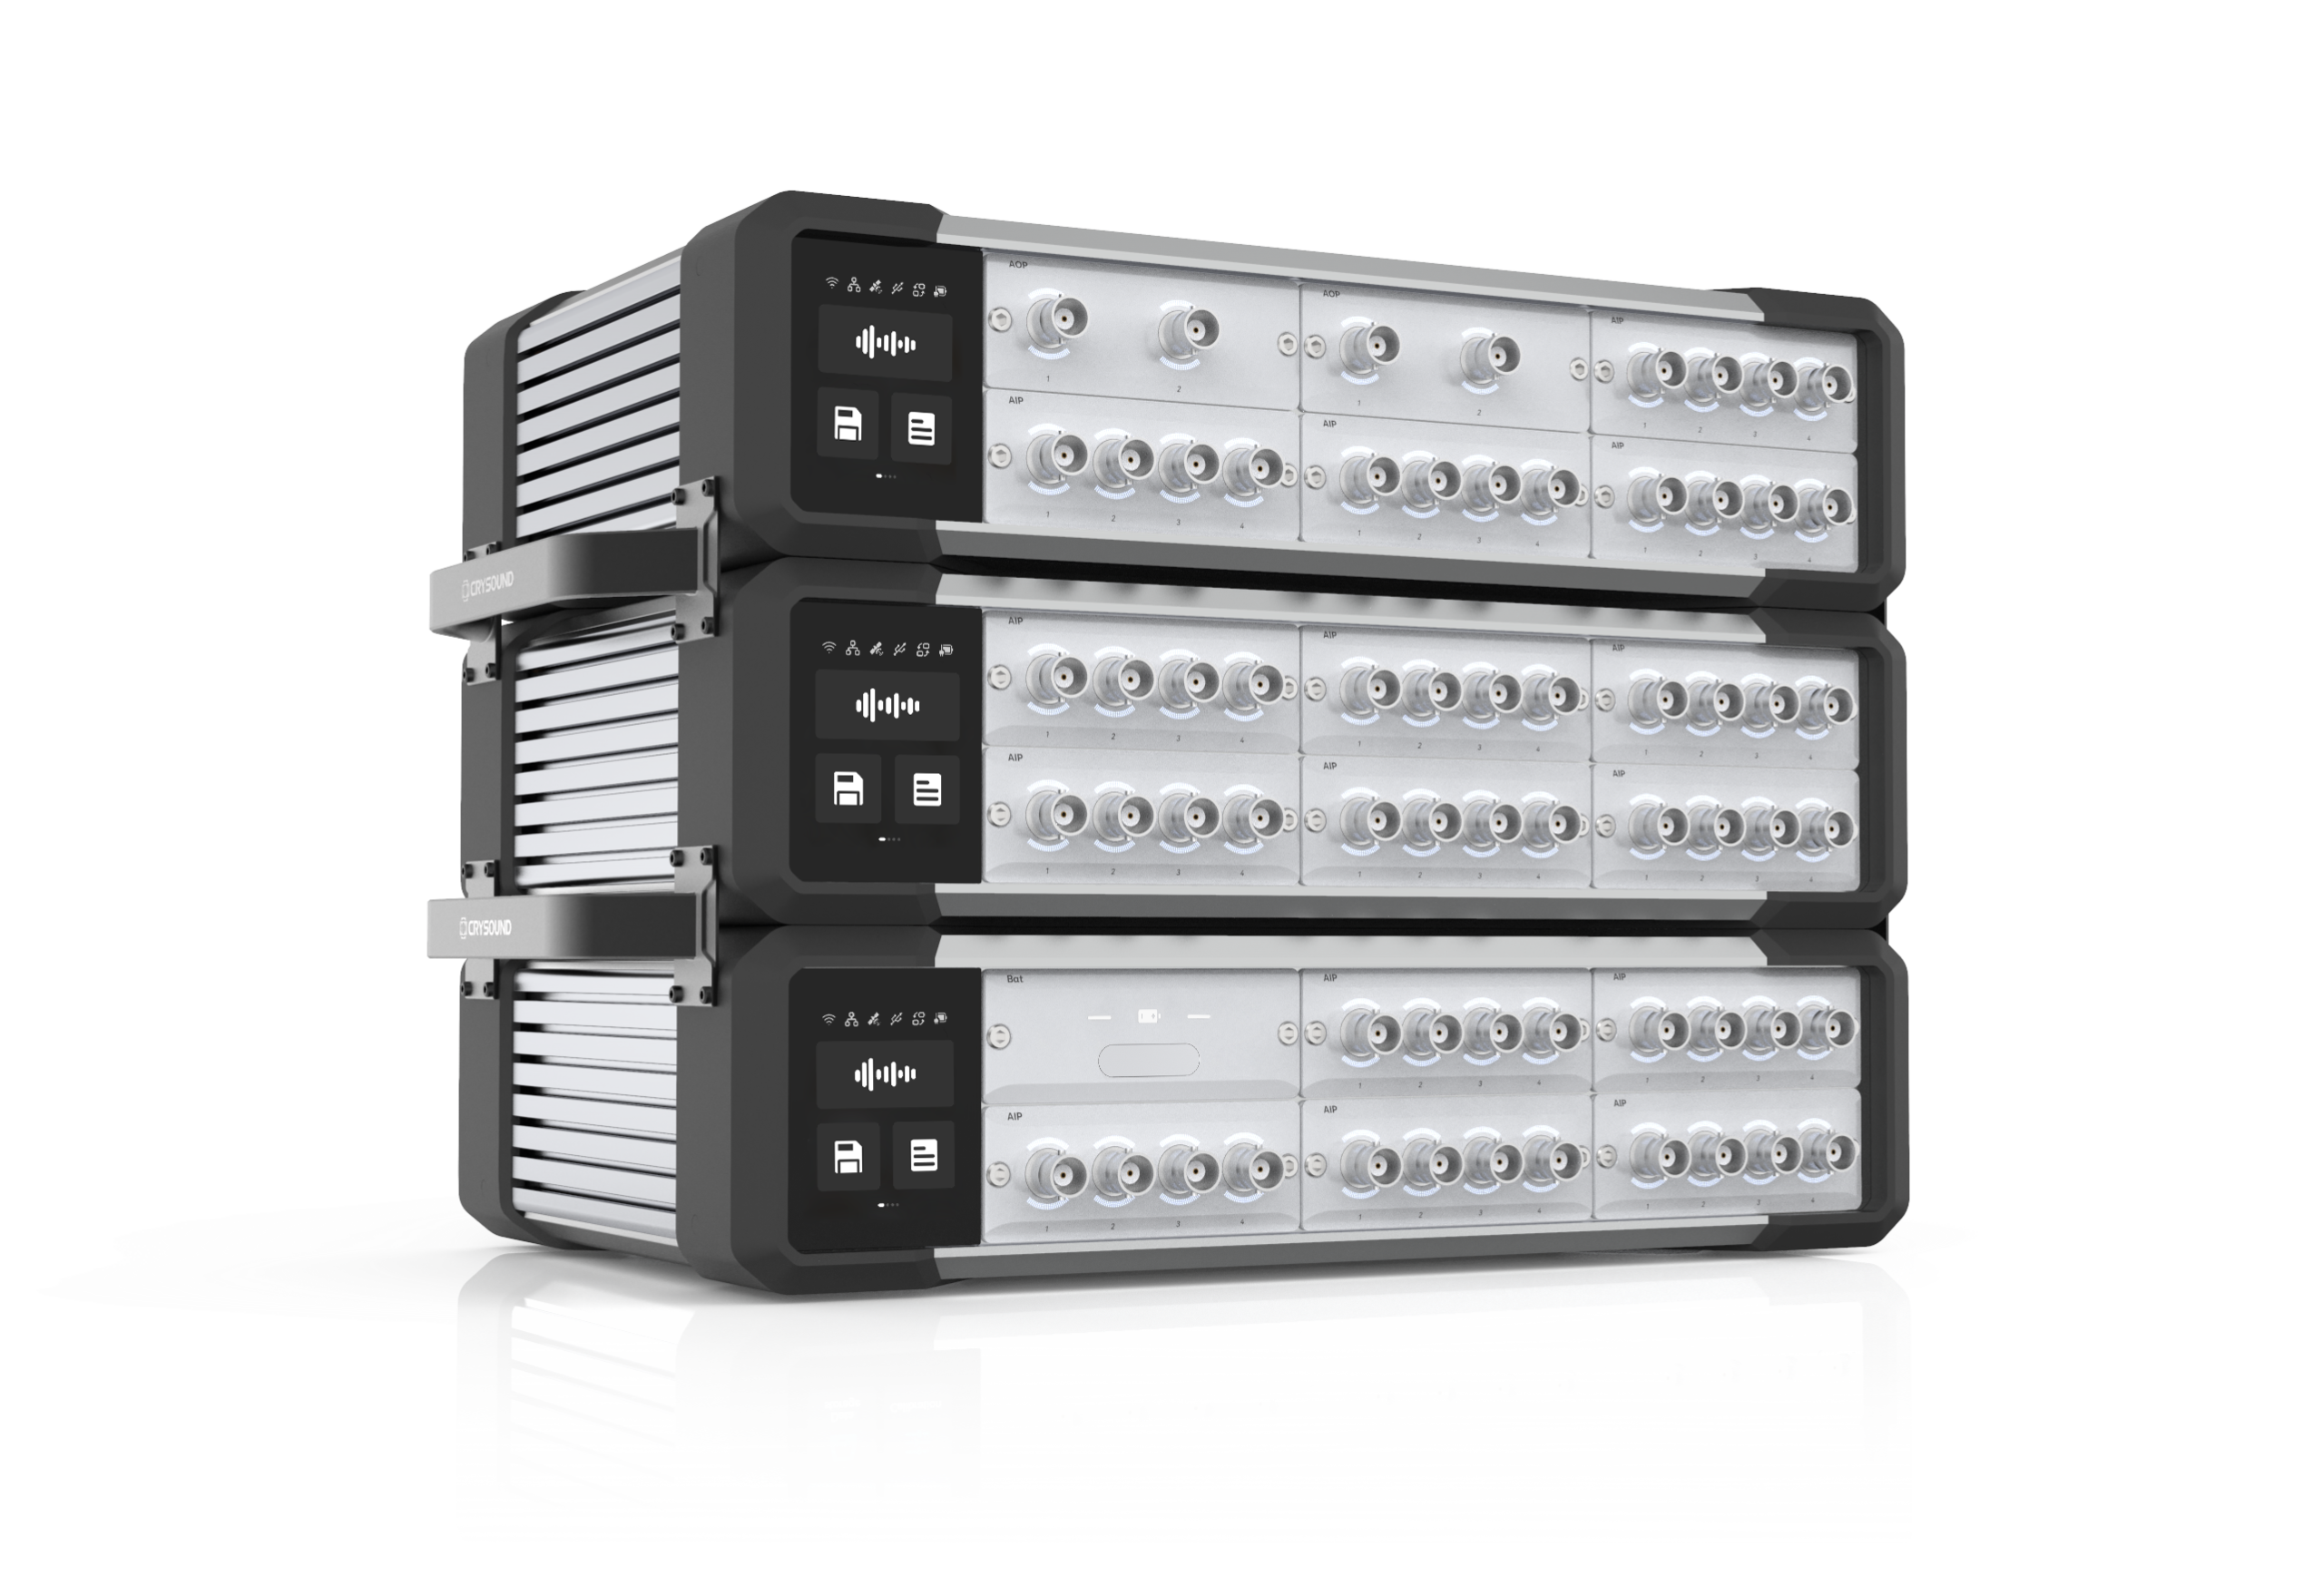
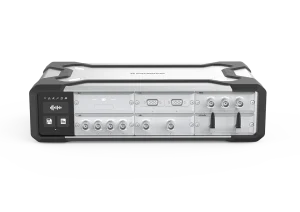
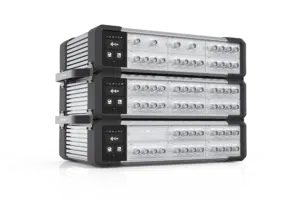
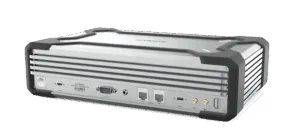
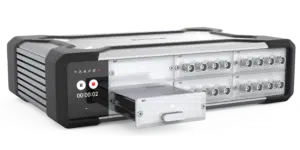
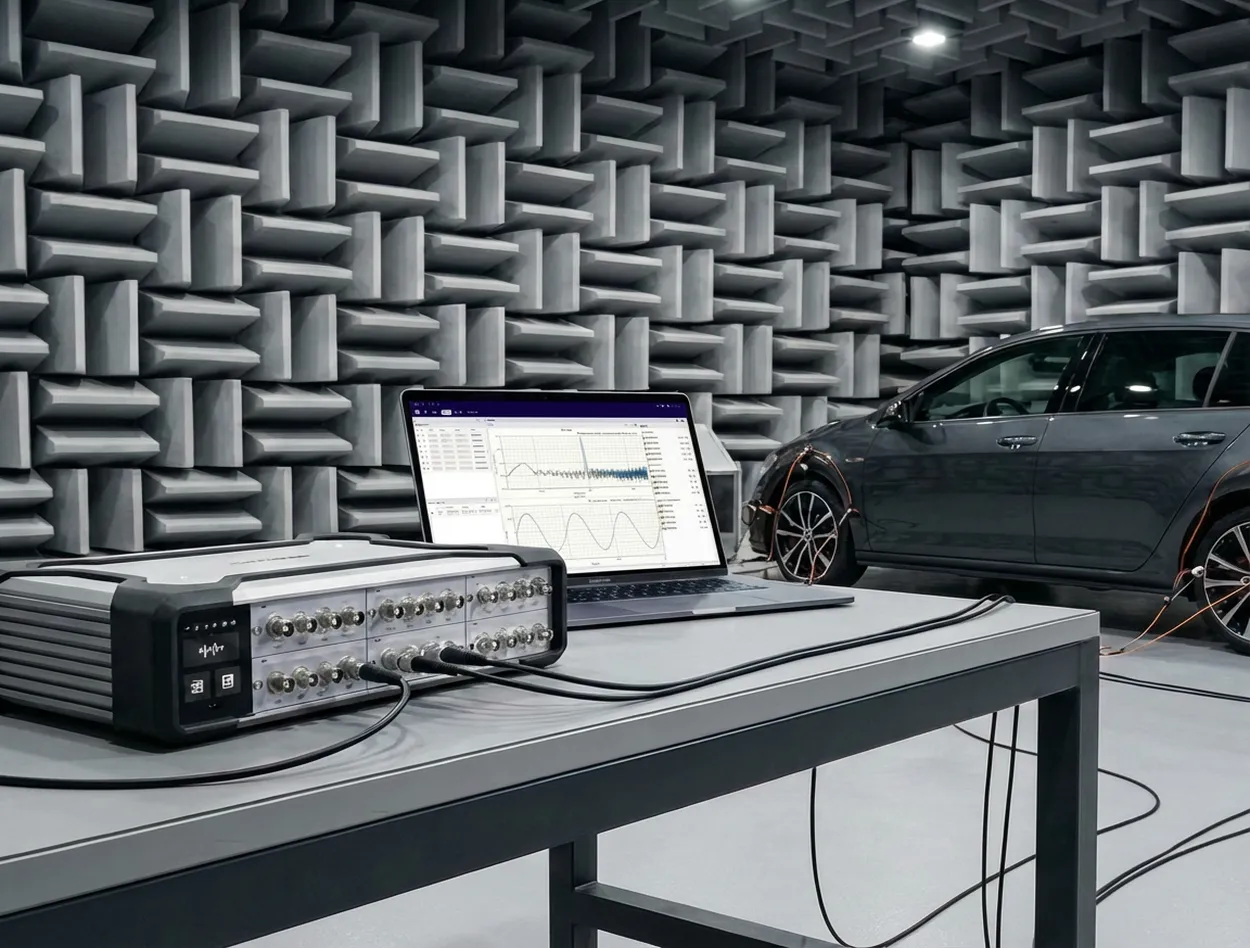
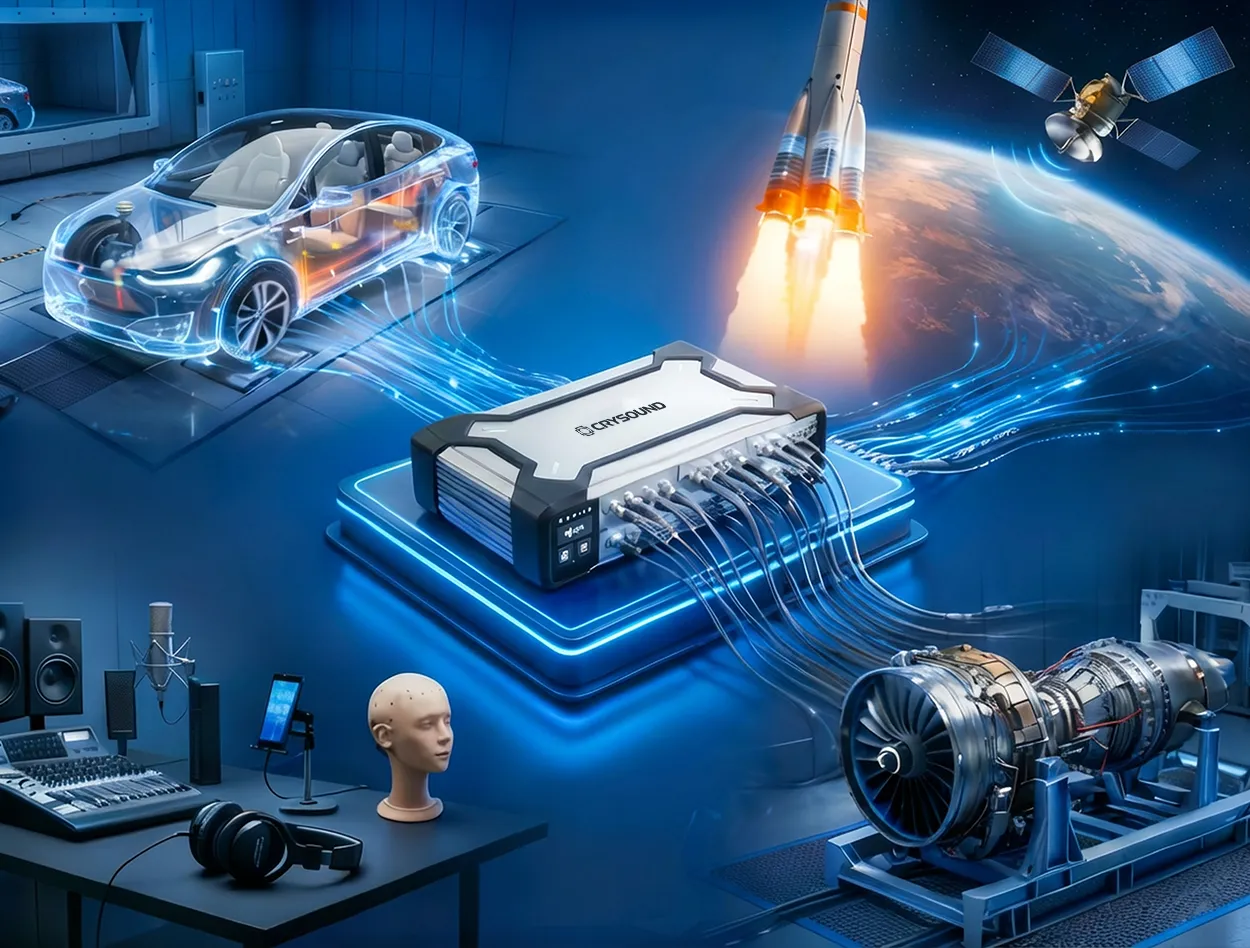
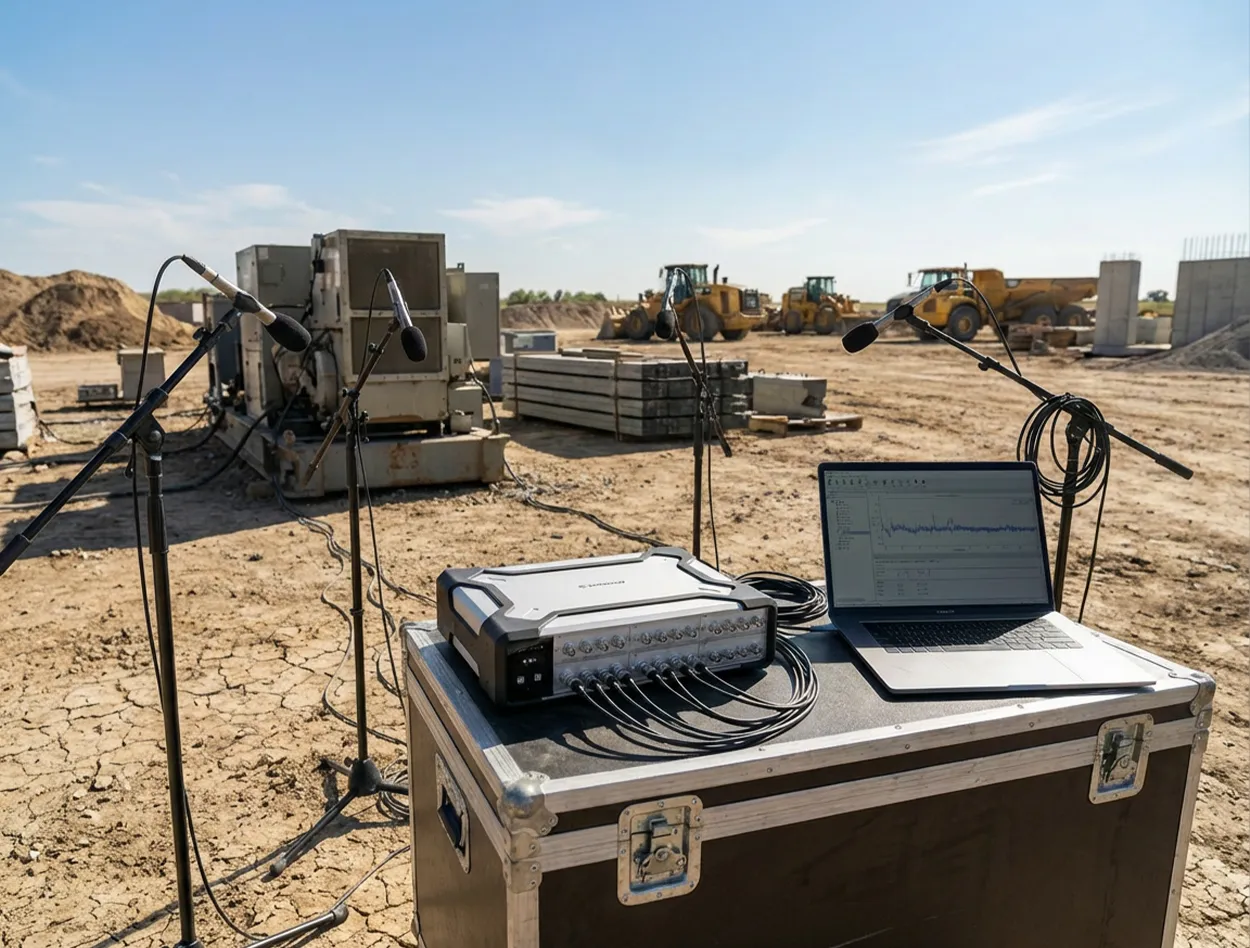
SonoDAQ Pro is a modular DAQ system designed for acoustic and vibration testing. It integrates power management, clock synchronization, local storage, and network communication into a single platform. With flexible modules and network topologies, it can be configured for small desktop setups or expanded to large-scale distributed systems with thousands of channels. SonoDAQ Pro simplifies test infrastructure by consolidating multiple devices into one system. In the lab, it supports Audio and NVH testing, while in the field, it offers long-duration recording with battery and local storage. Multiple units can be synchronized for simultaneous data acquisition, reducing setup complexity and maintenance costs, and enabling users to focus on testing and analysis.
NEW

CRY5820 SonoDAQ Pro

Optional Modules

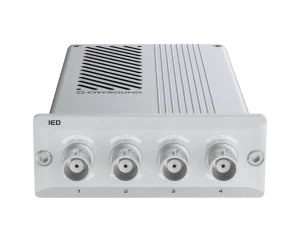
  • >> 4-channel analog input
  • >> 204.8 kHz sampling rate, 32-bit resolution
  • >> Dynamic range 160 dB
  • >> IEPE powered
  • >> Maximum input range 90 Vpk
  • >> THD+N < -102 dB
  • >> Noise floor < -117 dBV
  • >> Crosstalk < -130 dB
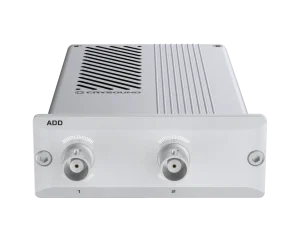
  • >> 2-channel analog output + 2-channel Class D 10W amplifier / impedance measurement
  • >> Sampling rate 192 kHz, 32 bit resolution
  • >> THD+N < -105 dB
  • >> Crosstalk < -147 dB
  • >> Noise floor < -117 dBV
  • >> Maximum output voltage 30 Vpk
  • >> Impedance measurement range 4Ω to 600Ω
  • >> Output Voltage 12.6V
  • >> Cell Capacity 71Wh
  • >> Up to 2 BAT modules can be inserted into a single chassis

Software

NEW

CRY5820 SonoDAQ Pro

SonoDAQ Pro is a modular DAQ system designed for acoustic and vibration testing. It integrates power management, clock synchronization, local storage, and network communication into a single platform. With flexible modules and network topologies, it can be configured for small desktop setups or expanded to large-scale distributed systems with thousands of channels.

SonoDAQ Pro simplifies test infrastructure by consolidating multiple devices into one system. In the lab, it supports Audio and NVH testing, while in the field, it offers long-duration recording with battery and local storage. Multiple units can be synchronized for simultaneous data acquisition, reducing setup complexity and maintenance costs, and enabling users to focus on testing and analysis.

Product Highlights
Flexible Scalability — Expandable to 1000+ Channels

Flexible Scalability — Expandable to 1000+ Channels

SonoDAQ features modular scalability, supporting 4–24 channels per unit and expandable to 1000+ channels via daisy-chain, star, or hybrid topologies. Each slot supports  independent sampling rates, offering maximum flexibility.
Beyond simple channel expansion, SonoDAQ ensures true plug-and-play usability. From small bench-top experiments to full-vehicle tests, engineers can expand seamlessly without workflow changes, saving time and reducing setup complexity.

Modular Design

True Plug-and-Play

Flexible Scalability — Expandable to 1000+ Channels
Nanosecond-Level Synchronization

Nanosecond-Level Synchronization

The SonoDAQ achieves nanosecond-level synchronization across distributed systems, with main frame to main frame skew less than ±100 ns. By integrating IEEE 1588 PTP and GPS timing, it eliminates the need for bulky sync cables. This is critical for applications such as order tracking, acoustic holography, and precise NVH analysis, where even microsecond drift can distort results.
In addition, SonoDAQ maintains amplitude and phase consistency over 1000 hours of operation, ensuring long-term stability. Engineers can conduct advanced testing with confidence, improving both data reliability and efficiency.

PTP or GPS Synchronization

Main frame to Main frame Skew ≤ 100 ns

Nanosecond-Level Synchronization
Capture Any Signal — Acoustic, Vibration, and Beyond

Capture Any Signal — Acoustic, Vibration, and Beyond

SonoDAQ supports a wide range of signals, including noise, vibration, strain gauges, thermocouples, charge inputs, and voltage/current. A single system can handle acoustic, vibration, thermal, and electrical inputs.
This compatibility reduces the need for multiple DAQs, lowering cost and complexity. It improves efficiency and extends usability across industries from automotive to aerospace.

Multi-Physics Testing

Hot-Swappable Battery

Capture Any Signal — Acoustic, Vibration, and Beyond
Low Noise Floor and Wide Dynamic Range

Low Noise Floor and Wide Dynamic Range

With 32-bit ADC resolution,1000V isolation, 160 dB dynamic range, and noise floor down to 1.3 µV, SonoDAQ captures both powerful impacts and faint anomalies with precision, ensuring data integrity.
It guarantees high fidelity and wide-bandwidth, distortion-free recording, enabling engineers to analyze complex frequency behaviors with confidence.

32bit resolution

1000V isolation

Dyanmic Range: 160 dB

Low Noise Floor and Wide Dynamic Range
Robust Design with Industrial-Grade Protection

Robust Design with Industrial-Grade Protection

SonoDAQ is built with an aluminum alloy frame reinforced with carbon fiber, combining lightweight design with strength. With IP43 protection and -10 °C to +50 °C operating range, it performs reliably in labs and harsh field conditions.
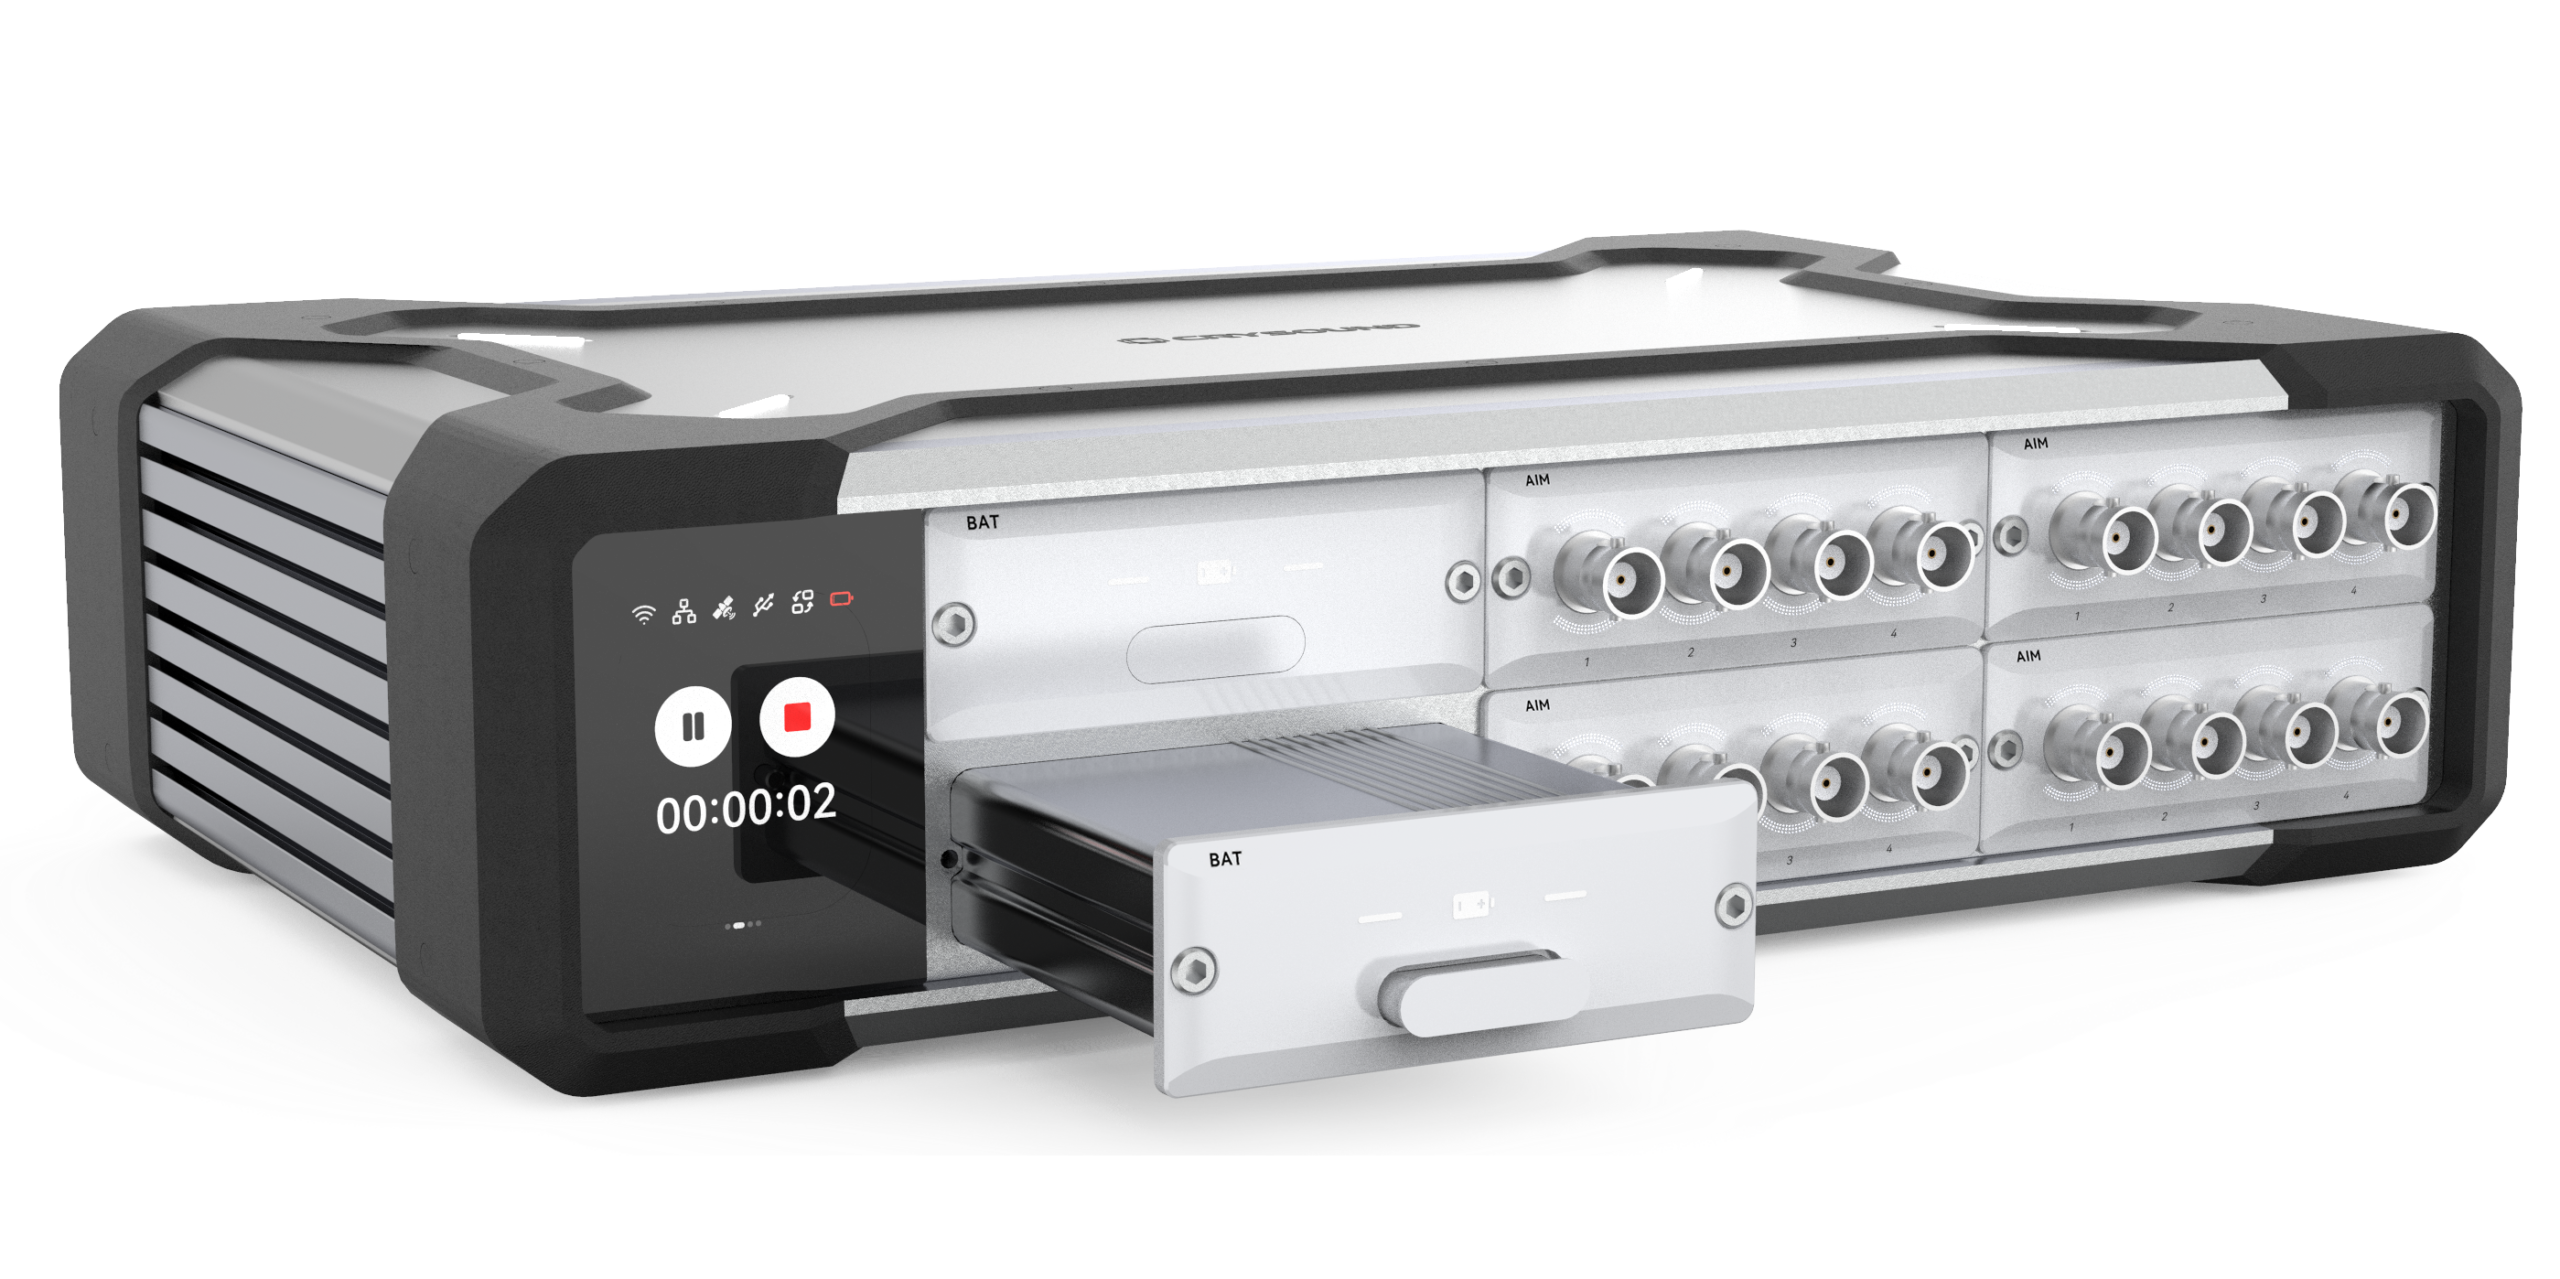
With triple power options—adapter, PoE, and hot-swappable batteries—it ensures uninterrupted operation even under unstable power conditions, increasing reliability.

Aluminum Alloy Frame

Carbon-Fiber Structure

Robust Design with Industrial-Grade Protection
Open Interfaces — Enabling a Collaborative Ecosystem Across Hardware and Software

Open Interfaces — Enabling a Collaborative Ecosystem Across Hardware and Software

SonoDAQ provides open-standard interfaces such as ASIO and openDAQ, ensuring seamless compatibility with a wide range of test and analysis software platforms.

Open Interfaces — Enabling a Collaborative Ecosystem Across Hardware and Software
Technical Specifications
lsolation
1000V
Channel
24 channels per chassis
Interface
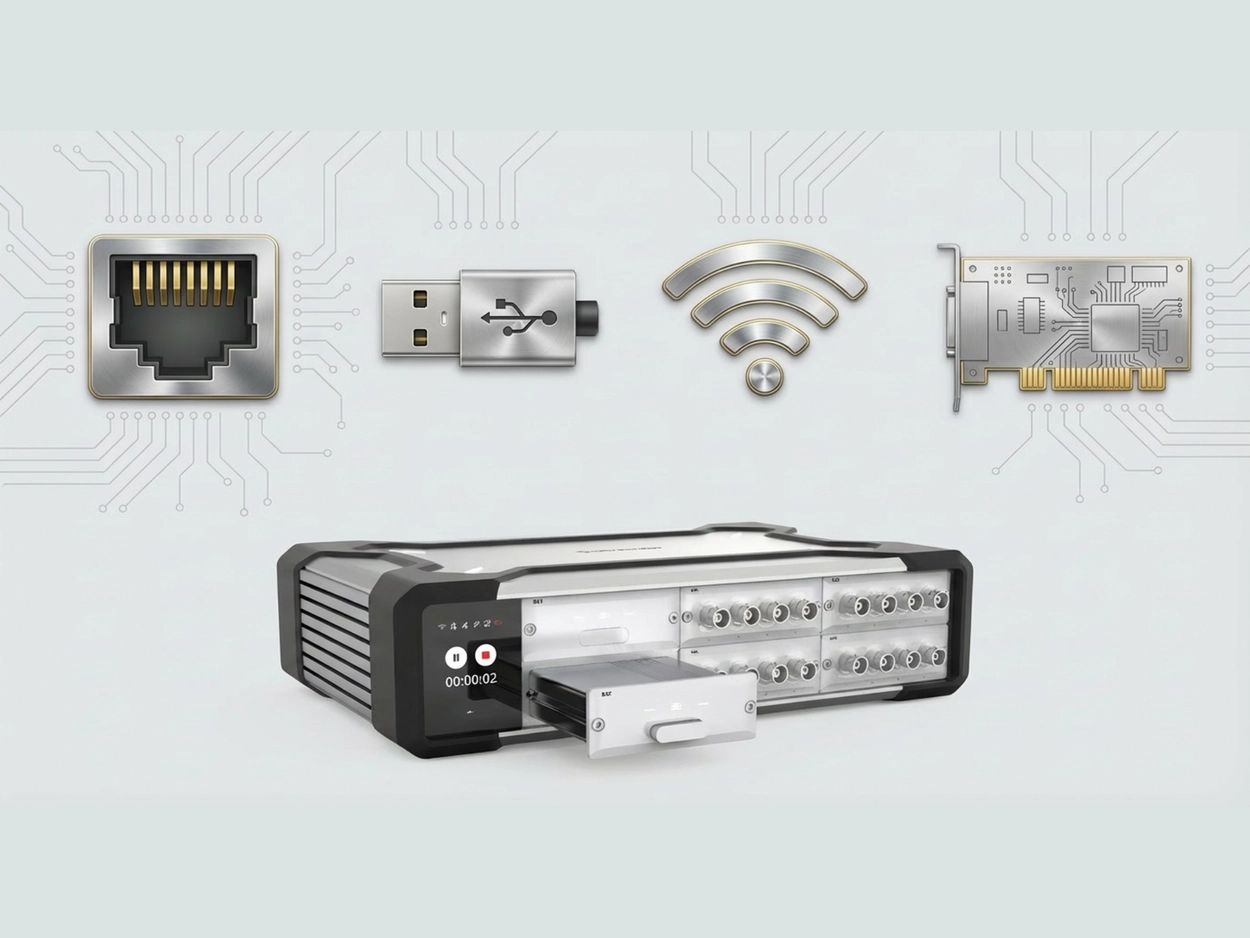
USB-C / GLAN / CAN FD / WIFI
Synchronization
PTP (IEEE 1588)/ GPS
Power
DC / PoE++ / Battery
Internal Storage
256GB microSD card (2TB optional)
Calibration
Self-calibration/On-site calibration service
Firmware Upgrade
OTA/Browser
Ambient Temperature
-10°C~50°C
Heat Dissipation
Fanless
Class of Protection
IP 43
Edge AI
6 TOPS NPU
Channel
4
ADC Resolution
32bit
Sampling Rate
(8/16/24/32/48/96/192/25.6/51.2/102.4/204.8) kHz, Configurable
coupled modes
AC/DC, Configurable
Signal input type
Differential/Single-ended
Frequency accuracy
±2 ppm (-10 ℃ ~ 50 ℃)
Module isolation voltage
1000V
THD+N
≤-102 dB (20 Hz ~ 20 kHz)@1 kHz
Cross Talk
<-130 dB@1 kHz
Noise Floor
≤-117 dBV (20 Hz ~ 20 kHz)
Maximum Input Voltage
31.4 Vpk
Input Impedance
≥100 kΩ
TEDS
support
Channel
2
ADC Resolution
32bit
Output Mode
Signal / Class-D Amplifier, Configurable
Output Signal Type
Differential/Single-ended
THD + N
≤-105 dB (20 Hz ~ 20 kHz)@1 kHz
Amplitude Accuracy
±0.35%(15 ℃ ~ 30 ℃)
Crosstalk
<-147 dB@1 kHz
Maximum Output Voltage
30 Vpk
Output Power
10W @ < 0.2% THD +N (8Ω load)
Output Impedance
4 Ω ~ 600 Ω
Main Features

Related Products

What Does "1000 V Isolation" Actually Isolate?

In many practical applications, data acquisition is not performed in an “ideal laboratory” environment. The device under test may be connected to mains power, distribution cabinets, frequency converters, or large electromechanical systems, while the acquisition card on the other side is connected via USB or Ethernet to a computer—sometimes operated directly by a person. These two sides are often not at the same electrical potential. If there is no effective electrical isolation inside the data acquisition card, this potential difference may propagate through signal lines, shields, or ground paths to the system side, leading to measurement distortion, interface malfunction, or even safety hazards. This is the fundamental reason why isolation exists in data acquisition systems. What Is the Isolation Rating of a Data Acquisition Card? In a data acquisition system, the isolation rating is not a simple voltage number, nor is it equivalent to “the voltage that the input can directly withstand.” It describes whether there is a reliable electrical isolation barrier between the measurement side (connected to sensors and the device under test) and the system side (connected to the host computer, communication interfaces, and power supply), and under what level of voltage stress this isolation remains valid. Isolation principle You can think of isolation as a bridge between two islands: The bridge allows information to pass—measurement data, digital communication, control signals. But it blocks dangerous currents—fault currents, ground-loop currents, and energy that could carry high potential to the host side. For this reason, isolation in data acquisition systems typically addresses both safety and measurement stability at the same time. Why Is Isolation Often More Important Than Accuracy Specifications? In many field applications, engineers do not encounter problems such as “insufficient resolution,” but instead: The same system works well in the lab, but noise increases dramatically on site. Once multiple devices are connected together, the data begins to drift. Replacing the computer or using a different power outlet suddenly makes the problem disappear. The common root cause behind these phenomena is often not algorithms or ADC performance, but rather improper handling of electrical potential relationships within the acquisition system. The value of isolation lies precisely here: by breaking unnecessary current loops and limiting the propagation paths of common-mode voltage and fault energy, isolation allows the acquisition system to behave in a controlled and predictable manner even in complex electrical environments. In industry discussions, the core values of isolation usually fall into three categories: signal integrity, safety, and instrument protection. Signal Integrity: Breaking Ground Loops and Improving Common-Mode Rejection Many cases of “inaccurate measurement” are not caused by ADC resolution, but by unwanted currents flowing through ground wires or shields. When the device under test and the host computer, enclosure, or other equipment are at different ground potentials, connecting them via signal cables may form ground loops. Power-line interference and electromagnetic noise then appear as “baseline noise” or ripple in the waveform. Isolation improves this by breaking the current loop paths. Safety: Confine High Potential and Fault Energy to the Measurement Side When measurement points are located near mains power, distribution cabinets, or frequency converters, the real risk is not merely “high voltage,” but where abnormal voltage or fault energy may propagate. If there is no clear electrical isolation between the measurement side and the host side, this energy may travel through signal or ground connections into the computer or communication interfaces, causing equipment damage or safety hazards. Isolation establishes a clear internal safety boundary: high potential and uncertain electrical environments are confined to the measurement side, while the system side—where the host computer and operator reside—remains within a controlled and safe potential range. If an abnormal condition occurs, the problem is contained on the measurement side and does not propagate further. Instrument Protection: A Larger Measurable Window Under High Common-Mode Voltage A non-isolated acquisition system effectively binds the measurement reference ground to system ground or earth. As a result, the measurable input range is centered around earth potential. If the entire signal shifts to a high common-mode potential, the front-end amplifier or ADC may exceed its allowable range or even be damaged. An isolated system allows the measurement reference to “float,” enabling the input measurement window to be centered around the isolated local ground. This permits operation under much higher common-mode voltages, with the ultimate limits determined by the isolation barrier and input protection circuitry together. Commonly Confused Isolation-Related Terms Isolation is often misunderstood because a single term—“isolation voltage”—is used to answer very different questions. The following clarifies these related but distinct concepts. Common-Mode Voltage Common-mode voltage refers to the voltage that is simultaneously applied to both measurement inputs relative to the acquisition system reference ground. It is not the signal of interest. The measurement signal concerns the difference between two input terminals, whereas common-mode voltage describes how high the two terminals are elevated together relative to ground. For example, in battery stacks or floating power systems, the signal itself may be only a few volts, but the entire source may be elevated tens or hundreds of volts above the acquisition card ground. In industrial environments, ground noise or electromagnetic interference may also impose time-varying AC voltage on both measurement leads. These “collectively elevated or oscillating voltages” constitute common-mode voltage. Working Voltage Working voltage is the voltage that can be continuously applied to a device over long periods. It is typically understood as the combination of measured voltage and common-mode voltage, and represents the condition under which the device can operate reliably over time. Withstand Voltage Withstand voltage refers to whether the isolation barrier can survive a very high voltage applied for a short duration without breakdown or damage. To verify this, a dielectric withstand (hipot) test is typically performed. During such a test, a voltage significantly higher than normal operating conditions is applied across the isolation barrier for approximately one minute. If no breakdown, abnormal leakage, or functional damage occurs, the isolation barrier is considered electrically robust. It is critical to note that withstand voltage does not indicate that the device can operate continuously at that voltage. It is a safety and quality verification metric, demonstrating that the insulation will not fail immediately under abnormal or extreme conditions. Input Overvoltage Protection Input overvoltage protection specifies the maximum allowable differential voltage between the positive and negative terminals of the same input channel. Exceeding this limit may damage the input circuitry. This is fundamentally different from isolation withstand voltage: Isolation withstand voltage applies between the measurement side and the system side. Overvoltage protection applies between the positive and negative terminals of the same channel. Measurement Category (CAT) Measurement category defines the severity of transient overvoltage that a measurement system may encounter in its electrical environment. Categories increase from CAT I to CAT IV: CAT I: Low-energy electronic circuits. CAT II: Household appliances and receptacle outlets, typically protected by indoor distribution panels. CAT III: Industrial distribution cabinets and environments with large motors, pumps, or compressors, subject to switching transients and inductive load surges. CAT IV: Outdoor power distribution points exposed to surges and lightning strikes. Pollution Degree Pollution degree describes environmental factors such as dust, moisture, and condensation that affect insulation surfaces. Higher pollution degrees reduce effective insulation performance, requiring higher baseline insulation strength. What Does "1000 V Isolation" Actually Mean? When a specification states “1000 V isolation,” three immediate questions must be asked, otherwise the number has no real comparability: Is it AC or DC? Is it Vrms, Vpk, or Vdc? Is it withstand voltage (short-term) or working voltage (long-term)? What exactly is isolated? Channel-to-ground? Channel-to-channel? Measurement side to USB/host side? The most important takeaway is this: “1000 V isolation withstand” does not automatically mean the system can continuously operate at 1000 V common-mode voltage, nor does it mean that 1000 V can be directly applied to the input. Continuous capability depends on working voltage, measurement category, input overvoltage protection, and the entire system chain including sensors, cables, and terminals. How Isolation Is Implemented: Isolation Barriers and Signal Transfer Methods Isolation is not simply “air separation,” but a combination of structure, materials, and signal-coupling mechanisms. Common isolation signal-transfer methods include: Inductive / Transformer-Based Isolation Inductive isolation transmits energy or information via magnetic fields rather than direct electrical conduction, fundamentally based on Faraday’s law of electromagnetic induction. Inductive isolation chip block Inside the chip, planar coils are fabricated on silicon or within the package, forming transformer-like structures. Transmitter side: current → coil → alternating magnetic field Receiver side: magnetic field variation → induced voltage → signal recovery Advantages include very high common-mode transient immunity (CMTI), high speed, low jitter, long-term stability, and excellent channel consistency. Disadvantages include higher power consumption and cost compared with capacitive isolation. Capacitive Coupling Capacitive isolation uses the “DC-blocking, AC-passing” property of capacitors to achieve voltage isolation, relying on electric-field variation within the dielectric. Capacitive isolation chip block Signal variation → electric-field variation → displacement current coupling Advantages include low power consumption, small die area, high integration, lower cost, and high speed. Disadvantages include higher sensitivity to common-mode dv/dt, stricter PCB symmetry requirements, and higher dependence on reference-ground layout. Optical Isolation Optical isolation uses light as the isolation medium, with air or transparent insulation providing physical separation. The principle is photoelectric conversion plus spatial isolation. Optical isolation chip block Electrical signal → LED emission → photosensitive device → electrical signal Advantages include simple structure, extremely high withstand voltage, good performance for low-frequency and switching signals, and strong EMC characteristics. Disadvantages include slower speed due to device latency, higher variability, and unsuitability for high-precision synchronous systems. Comparison of Isolation Technologies ItemInductiveCapacitiveOpticalWithstand voltage★★★★☆★★★☆★★★★★Transmission speed★★★★☆★★★★★★★Common-mode immunity★★★★★★★★☆★★EMI immunity★★★☆★★★★★★★★★Stability★★★★★★★★★★★Low power★★★★★★★★★★Suitable for DAQRecommendedRecommendedNot recommended A frequently overlooked but critical metric here is CMTI. In high dv/dt environments such as inverters, SiC/GaN power supplies, and motor drives, the issue is often not how high the static common-mode voltage is, but how fast it changes. Rapid high-voltage transients may couple through parasitic capacitances across the isolation barrier, disrupting or corrupting data transmission. Therefore, isolation must withstand not only voltage magnitude, but also voltage transition speed. Common Isolation Topologies in Data Acquisition Before asking whether a DAQ card is isolated, a more important question should be asked: where is the isolation applied? Different products may use entirely different isolation domains, resulting in very different capability boundaries and application suitability. Common DAQ isolation topologies include: Channel-to-system-ground isolation Bank (group) isolation Channel-to-channel isolation Channel-to-System-Ground Isolation Definition: Each channel (or group of analog front ends) is isolated from system ground and host ground, while channels typically share a common reference ground. Channel-to-system-ground This topology can: Break ground loops between the measurement side and the host side. Prevent high potential or fault energy from reaching the computer, USB, or network interface. Significantly improve stability when measurement and host grounds differ. The entire DAQ effectively “floats” with the device under test, while the host remains on the safe side. Suitable scenarios include industrial field measurements where all channels share the same potential. Bank Isolation Definition: Channels are divided into groups (banks). Each bank has its own isolation domain, with isolation between banks and between each bank and system ground. Bank isolation This topology allows multiple independent systems to be measured simultaneously while preserving multi-channel synchronization within each bank, balancing cost, size, and isolation capability. Channel-to-Channel Isolation Definition: Each channel has a fully independent isolation domain and reference ground. Channel-to-channel isolation Each channel effectively functions as an independent isolated acquisition system, suitable for battery stacks, distributed measurements, and scenarios with large inter-channel potential differences, at the expense of higher cost, size, and system complexity. Isolation Selection: From Parameters to Practical Judgment After understanding isolation concepts, topologies, and voltage ratings, the key question becomes: does a given isolation design truly fit the application? Many misjudgments arise from focusing on a single number such as “1000 V isolation” without clarifying where isolation is applied, for how long, and what additional protections are required. What Is Being Isolated, and Where Does the Isolation Occur? If all measurement objects belong to the same system and there is no potential difference between them, a Channel-to-System Ground Isolation data acquisition card should be selected. If the measurement objects belong to multiple different systems, but the measurement points within each system share the same ground reference, a Bank Isolation (group isolation) architecture should be selected. In this case, measurement points from different systems must not be connected to the same bank of the acquisition card. If all measurement objects belong to the same system but there are significant potential differences between them, a Channel-to-Channel Isolation data acquisition card should be selected. This is the prerequisite for evaluating all isolation-related parameters.If the isolation location is unclear, other voltage specifications are almost meaningless for comparison. Isolation Withstand Voltage of a Data Acquisition System At a minimum, the following information must be clearly specified:whether the voltage is AC or DC, the duration (typically a 1-minute withstand test), and only then the voltage value itself. If a data acquisition card specifies an AC isolation voltage of 1000 V, it means that an AC voltage with a peak value of ±1414 V is applied between the circuit grounds on both sides of the isolation barrier, and after 1 minute the leakage current remains below 0.1 mA. If a data acquisition card specifies a DC isolation voltage of 1000 V, it means that a +1000 V or −1000 V DC voltage is applied between the circuit grounds on both sides of the isolation barrier, and after 1 minute the leakage current remains below 0.1 mA.However, one must not assume that ±1000 V AC can be applied in this case—the two are not equivalent, because different devices have different withstand capabilities for AC and DC voltages. It should be emphasized that the withstand voltages discussed above are short-term withstand ratings. They do not mean that the device can operate continuously at a 1000 V common-mode voltage. They only indicate that the device will not be damaged under those conditions, not that normal operation is guaranteed. Maximum Common-Mode Operating Voltage This is the parameter that deserves particular attention when selecting a data acquisition card. In most cases, it refers to the long-term voltage difference between the measurement side and the system ground. For example, if we want to measure the current on a 220 V mains line, the corresponding common-mode voltage is: 220 V × 1.414 = 311 V Allowing at least a 50% margin, the data acquisition card should therefore support a maximum common-mode operating voltage greater than 466 V. If a specification sheet only provides isolation withstand voltage but does not clearly specify working voltage or maximum common-mode range, extreme caution is required in practical use. Input Voltage Range The input voltage range is also referred to as differential voltage. It defines how much voltage difference the input terminals of a channel can tolerate. The key question is what happens when this limit is exceeded:is the signal clipped, is the input shut down, or is permanent damage caused? This parameter determines whether the device can protect itself under wiring errors or abnormal conditions, or whether it will fail catastrophically. If the distinction between common-mode voltage and differential voltage is still unclear at this point, the following analogy may help. Measuring Across a River In the diagram, the person cannot approach the apple directly because of the river acting as an isolation barrier, so a caliper with an extended handle is used to measure the apple on the opposite bank. The 300 cm distance across the river corresponds to the common-mode voltage in the system, while the measurement range of the caliper (20 cm) corresponds to the differential voltage range. Isolation Structure of the SonoDAQ Module (Bank Isolation Example) After distinguishing between channel-to-ground isolation, bank isolation, and channel-to-channel isolation, as well as various isolation parameters, the next question for a specific product is: where exactly is the isolation boundary drawn? The following figure shows the isolation structure of a SonoDAQ module, illustrating the division of its isolation domains. SonoDAQ Module Isolation From the module structure, it can be clearly seen that SonoDAQ Pro adopts a bank isolation architecture (see Section 6.2). Each module is isolated from the host, while the four channels on each module are not isolated from each other. The module divides functionality and electrical domains into three parts: Measurement Side: Located on the left side of the module, directly connected to sensors and the device under test. This belongs to the measurement-side electrical domain and may be at a high or uncertain common-mode potential. Bank Isolation Domain: Located in the middle of the module, this is the primary isolation barrier between the measurement side and the system side. Multiple channels within the same bank share a common measurement-side reference ground and are collectively isolated from the system side through this isolation domain. As shown in the diagram, two types of isolation circuits are used: capacitive isolation for digital communication and magnetic (transformer-based) isolation for power. System Side: Located on the right side of the module, communicating with the host through the backplane. This side operates under system ground reference and connects to processors, communication interfaces, and the host computer. From Concept to Verification: Isolation Must Be Proven, Not Assumed Through the previous discussion, we have distinguished between differential and common-mode voltages and understood the respective roles of isolation withstand voltage, working voltage, and common-mode capability. While these concepts are not complex in specifications or standards, a more critical question remains in real engineering practice: Do these isolation boundaries actually hold under real-world conditions as the parameters suggest? For example, when the device under test operates at a high common-mode potential, the acquisition system must run online for extended periods, and the host computer and operators must always remain on the safe side. Simply “trusting a specification value” is far from sufficient. Rather than staying at the conceptual level, it is better to return to engineering practice. The following two experiments are not intended to demonstrate extreme parameter limits, but to address a more practical question. For this purpose, SonoDAQ Pro was selected as the test platform—not because of exceptionally high specifications, but because its isolation structure is clear and its boundaries are well defined, making it suitable for engineering-level isolation verification. The experiments are conducted from two perspectives: withstand voltage testing (hipot) and mains-powered incandescent lamp current measurement. Withstand Voltage Test (Hipot) Test objective: To verify that the isolation barrier can withstand high voltage under specified conditions without breakdown, providing an intuitive engineering verification result The general industry definition of dielectric withstand testing is to apply an elevated voltage across an insulation barrier for approximately 1 minute. Passing the test indicates that the insulation system has sufficient electrical strength under those conditions, while also clarifying the purpose and limitations of the test to avoid misinterpretation. Test equipment: WB2671 hipot tester Test conditions: 1000 V DC, duration 1 minute, leakage current threshold 0.1 mA Withstand Voltage Test Test Results 1.02 kV DC, duration 1 minute, leakage current = 0.03 mA, with no breakdown, flashover, or arcing observed. Explanation: SonoDAQ Pro adopts a bank isolation architecture, where the six slots are isolated from each other. Therefore, during testing, the hipot voltage was applied between Channel 1 of two adjacent modules. 220 V Mains Incandescent Lamp Current Measurement Experiment Test objective: To demonstrate how the data acquisition card can measure signals in a high-voltage system under real mains conditions, and to verify measurement correctness. Why an incandescent lamp? Its steady-state behavior closely resembles a resistive load, making current waveforms intuitive and easy to interpret. The cold filament has low resistance, producing a clear inrush current at power-on, which is suitable for demonstrating transient capture and trigger recording capability. 220 V Mains Incandescent Lamp Current Measurement Wiring In the diagram, the left side is the high-voltage area directly connected to the 220 V AC source. After all wiring is completed, the power plug is inserted. The right side contains the isolated data acquisition card, forming the low-voltage area. The computer and operator remain entirely on the safe side. The experiment used SonoDAQ Pro hardware with OpenTest software. The incandescent lamp was rated at 220 V / 60 W. The following photos show the setup before power-on (left) and after power-on (right). 220 V Mains Incandescent Lamp Current Measurement Test configuration: sampling rate 192 kSa/s, AC coupling for the input signal. The acquisition card directly measured the voltage across a 1.4 Ω shunt resistor. Using the “Record” function in OpenTest, the entire power-on and power-off process was recorded. Steady-State Current Waveform Steady-state current:Vrms = 386 mV → Irms = 386 / 1.4 = 275.7 mAFrequency f = 49.962 Hz Startup Transient Current Startup current:Vpeak = 2.868 V → Ipeak = 2.868 / 1.4 = 2.05 A Crest factor calculation:CF = Ipeak / Irms = 2.05 / 0.2757 = 7.44 Incandescent lamp power calculation:P = 220 V × 0.2757 A = 60.65 W Conclusion SonoDAQ Pro can accurately measure the operating current of an incandescent lamp connected directly to the mains without using a current transformer. This experiment does not merely verify whether mains signals can be measured; it verifies whether isolation can simultaneously ensure system safety and measurement accuracy when the device under test operates at a high common-mode potential over extended periods. Isolation Is Not a Parameter, but a Boundary Isolation is not “a single voltage value,” but rather defines where risk is confined and whether signals can still pass reliably. A reliable isolation solution is the result of structure, parameters, topology, and application scenario all being valid at the same time. To see more imformation about the SonoDAQ, please fill in the form below, and we will recommend the best solution to address your needs.


Ways to Connect a DAQ to a PC: Ethernet, USB, Wi-Fi, and PXIe

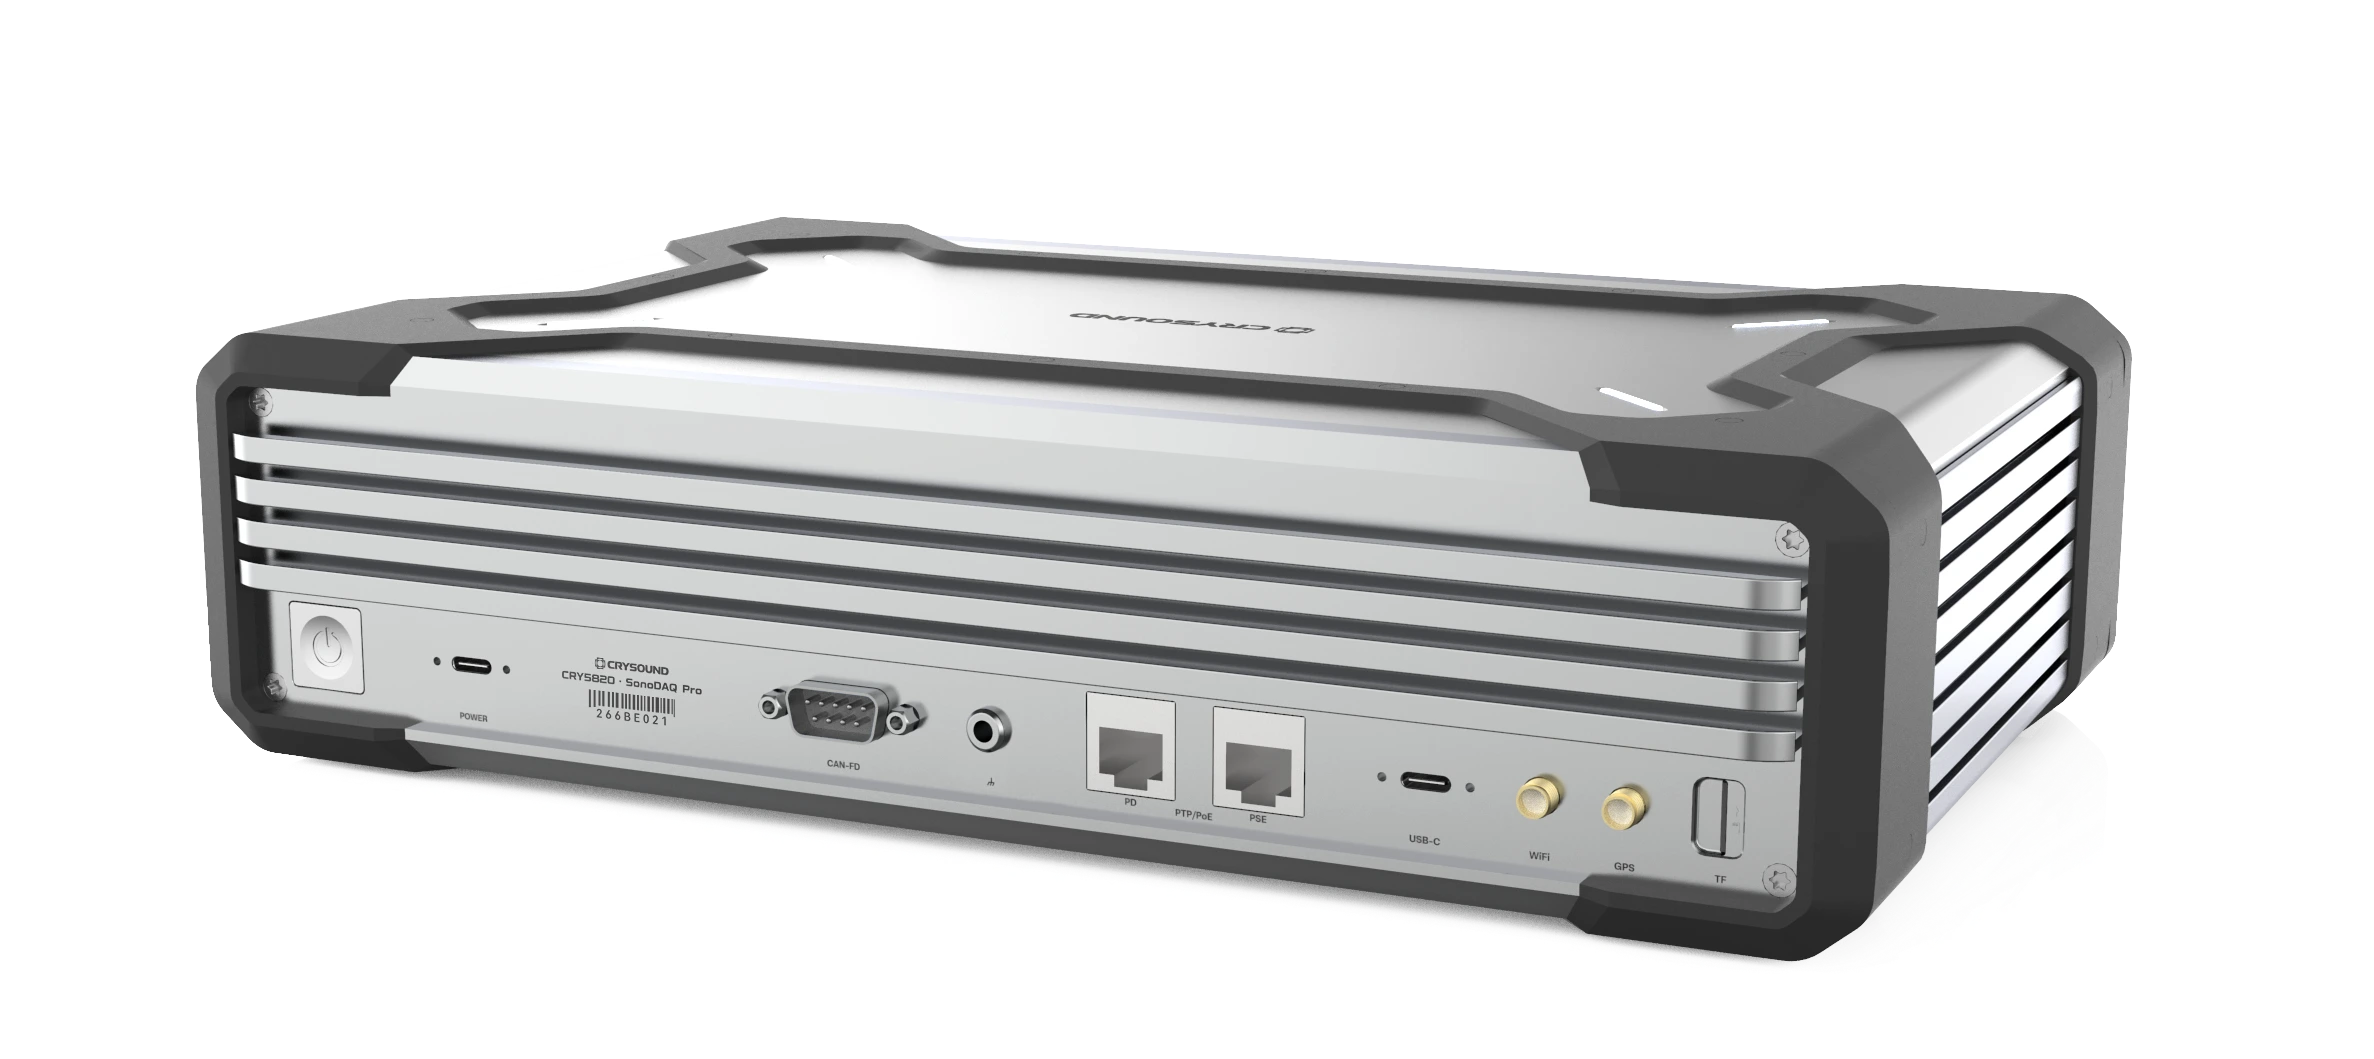
Before you begin any formal data acquisition work, one critical step is connecting the DAQ front end to the PC. In day‑to‑day engineering, the most common options include USB direct connection, Wi‑Fi wireless, Ethernet, and PXIe. This article introduces these four common connection methods from several angles—how they differ, where each one shines, and their practical limitations—to help you build a deeper, more intuitive understanding of DAQ connectivity. Ethernet Connection An Ethernet connection means the front end joins a local area network (LAN) through its network port, and the PC accesses the device over IP. A typical data path looks like this: Sensor → front‑end sampling → Ethernet transport (TCP/UDP, etc.) → PC/server storage and processing. This topology ranges from very simple to quite complex, for example: Front end ↔ PC (point‑to‑point direct link) Multiple front ends → switch → PC/server (distributed) Figure 1. Ethernet Connection Advantages of Ethernet Connections Flexible topology: single‑node, multi‑node, and distributed setups are all easy to organize; Comfortable distance and cabling: copper Ethernet or fiber makes it easier to deploy across rooms, floors, or even buildings—and routing can be more standardized; Mature infrastructure and strong maintainability: switches, cables, transceivers, fiber, and rack accessories are widely available, and issues are usually easier to locate and troubleshoot; Limitations of Ethernet Connections The network introduces uncertainty—topology, switch performance, port congestion, broadcast storms, and link errors can all cause throughput/latency fluctuations; With multiple devices/nodes, the need for network planning rises quickly: IP addressing, subnetting, whether to use DHCP, routing across subnets, switch cascade depth, etc. As the system grows, things can get messy without a plan. Cable quality, shielding/grounding, routing close to high‑power lines, poor port contact, or switch power instability may show up as packet loss, retransmissions, or speed‑negotiation anomalies. For engineers, Ethernet is straightforward on the test floor: in many setups, a single cable is enough to bring the DAQ front end online with the PC—parameter setup, start/stop, live monitoring, and logging all feel smooth. When the distance grows, you can extend the copper run or switch to fiber to keep transmission stable. In cross‑floor or multi‑room environments—or where noise/safety constraints make it inconvenient to stay near the rig—data can be acquired and monitored from an office or control room over the network. Of course, very long cable runs can be a headache in their own right. SonoDAQ Pro comes standard with two Gigabit LAN ports (GLAN, daisy‑chain capable, supporting 90 W PoE++ power delivery) and also provides a USB‑C port with gigabit‑class throughput, giving users more flexible network‑style connection options. Figure 2. SonoDAQ Rear Panel Wi‑Fi Connection Wi‑Fi DAQ means the acquisition node communicates with a PC or a LAN over a wireless network. Unlike simply “replacing the cable with wireless,” Wi‑Fi DAQ systems typically have two working modes: Real‑time streaming: after sampling, data is sent to the PC over Wi‑Fi in real time; Local buffering/storage: data is first buffered or stored on the front end; Wi‑Fi is used mainly for control, preview, transferring selected segments, or exporting after the run. Two common networking setups are: The DAQ front end joins an on‑site access point (STA mode); The PC creates a hotspot and the DAQ front end connects to it. In short, the front end must support Wi‑Fi, and it must be on the same LAN as the PC. Figure 3. Wi-Fi Connection Advantages of Wi‑Fi Connections No cabling: when wiring is difficult or not allowed, the DAQ can be placed close to the measurement point and controlled over Wi‑Fi; Flexible remote acquisition: by mapping the DAQ’s IP to the public Internet, the PC can access the DAQ by IP address for ultra‑long‑distance remote control. Limitations of Wi‑Fi Connections Uncertainty for sustained high‑volume transfers: available wireless bandwidth can change at any time, so long, continuous acquisitions are more likely to expose packet loss/retransmissions/buffer overflows—the heavier the data load, the more obvious this becomes; Stability depends heavily on the environment: multipath, co‑channel interference, AP congestion, and movement (changing the RF path) can all cause throughput swings and higher latency/jitter, showing up as choppy live plots or occasional disconnect/reconnect events. In real projects, Wi‑Fi is most often used when cabling is inconvenient or prohibited, or when remote/off‑site acquisition is required but running Ethernet is impractical. Engineers can configure parameters remotely, start/stop acquisition, monitor key metrics, or pull specific segments. For larger datasets or long‑duration logging, it’s common to pair Wi‑Fi with front‑end buffering/local storage—Wi‑Fi keeps things visible and controllable, while the front end protects data integrity. USB Connection A USB DAQ device typically means sampling happens in an external front end (with built‑in ADCs, signal conditioning, clocks, etc.). The PC handles configuration, visualization/analysis, and data storage, while USB “moves” the data into the computer. In this relationship, the PC acts as the USB host and the front end acts as the USB device. Figure 4. USB Connection Advantages of USB Connections Low barrier and quick to start: no IP setup and no dependency on network infrastructure—plug it in, install the driver/software, and you can usually start acquiring; Highly portable: an external box plus a laptop is a common combo, well suited to field work, customer sites, and temporary setups; Ubiquitous interface: cables, adapters, mounting clips, and docks are easy to source; Limitations of USB Connections Scalability is generally less “natural” than network/platform approaches. When a system grows from a single front end to multiple front ends and coordinated multi‑point measurements, cabling, device management, and synchronization depend more on the specific implementation; If multiple high‑throughput devices share the same USB controller (DAQ front end, external SSD, camera, etc.), you may see throughput fluctuations, buffer warnings, and occasional stuttering. USB controllers, driver stacks, system load, and power‑management policies vary from PC to PC, so the same device can behave differently on different hosts. Most USB front ends are portable external devices. They often integrate a reasonably complete set of general‑purpose measurement interfaces—analog inputs/outputs, digital I/O, counters/encoders, etc. With a single USB cable, you get both connection and control to the PC for acquisition, display, and storage. As a result, USB is widely used for temporary measurements in the field or at customer sites, rapid R&D bring‑up and debugging, and small‑channel, short‑duration tests. PXIe Interface PXIe is a platform form factor built around a chassis, backplane, and modules. Measurement/instrument modules plug into the chassis and interconnect through the backplane; the chassis then works with a controller or an external link to a PC workstation. Compared with a single external DAQ box, PXIe is more platform‑oriented, modular, and capable of system‑level composition. If a PXIe controller is installed in the chassis, the chassis effectively becomes the host and can run acquisitions independently. Without a PXIe controller, a PXIe chassis is typically not connected to a PC via a standard Ethernet port. Instead, it uses a remote‑control link that essentially “extends the PCIe bus” so an external PC can see the chassis modules as if they were local PCIe devices. In practice, the two most common options are MXI‑Express (a host interface card in the PC plus a remote‑control module in the chassis, linked with a dedicated cable) and Thunderbolt. A typical data path looks like this: Sensor → PXIe module sampling/processing → chassis backplane → controller/link → PC/storage Figure 5. PXIe interface Advantages of PXIe Interface You can populate the chassis with the functional modules you need (analog, digital, bus interfaces, switch matrices, etc.). System capability comes from the “module mix,” and adding or swapping modules later is straightforward; High level of engineering integration: power, cooling, and mechanical form factor feel more like a test platform. In rack/bench systems, cabling, maintenance, and spare‑parts management are easier to standardize; When a test system is expected to evolve—more channels, more functions, module upgrades over time—the platform’s long‑term scalability is a strong advantage. Limitations of PXIe Interface Higher cost and larger footprint: a chassis + module ecosystem is typically a bigger investment than “PC + single card/box,” and it tends to be a fixed installation. Less friendly for mobile/field work: for scenarios that require frequent transport and rapid setup, PXIe’s platform advantages can become a burden; Higher system‑build complexity: it’s more like building a test system, where rack layout, harness management, thermal design, power headroom, and grounding all need to be considered. In practice, SonoDAQ Pro adopts a PCIe‑based modular backplane architecture. Each functional module connects to the main control platform (ARM) through the backplane for high‑speed data uplink/downlink, synchronization, and power distribution. We call this internal interconnect “Trilink.” While enabling modular expansion, SonoDAQ Pro also supports external communication interfaces such as GLAN, Wi‑Fi, and USB‑C, significantly improving deployment flexibility. For a more hands‑on view of how SonoDAQ works over different connection methods (USB / Wi‑Fi / GLAN)—including real usage workflows, representative scenarios, and common configuration checklists—please fill out the Get in touch form below and we’ll reach out shortly.

SonoDAQ Pro: Flexible Sound and Vibration DAQ System

In sound and vibration testing, flexibility is a decisive factor—especially when test requirements evolve rapidly. SonoDAQ, with its modular, scalable architecture, helps users easily manage everything from simple tests with a single device to complex, large-scale, multi-channel data acquisition. Whether in laboratory environments or industrial sites, SonoDAQ provides efficient, accurate data acquisition solutions, maximizing the adaptability and scalability of the system. Easy Testing with One Device, Scalable Expansion with Multiple Devices When testing requirements are modest, such as road tests or basic vibration testing, SonoDAQ Pro can easily meet the required number of channels with a single device. In this case, users only need one device to perform high-precision data acquisition, which is efficient and helps avoid unnecessary upfront hardware investment. However, as testing needs increase, especially in scenarios that require numerous sensors or synchronized multi-channel acquisition, SonoDAQ offers flexible expansion solutions. Users can connect multiple SonoDAQ Pro units in a daisy-chain or star topology to achieve large-scale data acquisition. For example, when conducting NVH testing or sound and vibration testing for large equipment, users can add more devices as needed, scaling up to hundreds of channels while ensuring high-precision synchronization across all devices. This scalability allows customers to avoid purchasing entirely new acquisition systems each time. By simply cascading existing SonoDAQ Pro units, they can easily cover more complex testing needs and avoid the common issues of device redundancy and high costs seen in traditional systems. Flexible Configuration to Meet Various Needs Even without large-scale acquisition needs, SonoDAQ remains highly flexible. With its modular design, users can easily adjust and reconfigure the system according to changing test requirements. For instance, if only temperature or strain signals are required, users can simply select the corresponding module and insert it into the chassis, without purchasing a new mainframe. This design makes SonoDAQ suitable for everything from simple laboratory tests to complex field tests. Users can expand the system as needed, without worrying about future expansion limits. Whether it's basic data acquisition or advanced signal analysis, SonoDAQ provides accurate, flexible data acquisition solutions, significantly enhancing testing efficiency and cost-effectiveness. Flexibility Brought by Modular Design The modular design of SonoDAQ is the core of its flexibility. Users can select different input modules, output modules, sensor interface modules, and more based on project requirements, and easily plug-and-play or upgrade them as needed. Whether it's adding more sensor channels or expanding with new functional modules, users can quickly implement changes by swapping modules, without affecting the normal operation of the existing system. This design ensures long-term device usability and enables SonoDAQ to adapt to ever-changing test requirements. When future requirements change, such as testing additional signal types (e.g., temperature, pressure, strain), SonoDAQ Pro can easily meet these new testing needs by simply swapping modules, allowing the overall system to continue running efficiently without the need for a full system overhaul. For example, an automotive manufacturer needs to perform NVH testing. Initially, they may only need 4–8 channels for in-car noise testing. In this case, engineers can use a single SonoDAQ Pro device to complete routine testing tasks. When they need to expand the testing scope and add more sensors (such as measuring vibration, strain, or temperature at different locations), they can simply daisy-chain multiple SonoDAQ Pro devices together. Through synchronization technology, they can ensure data consistency across all devices without redesigning the system or changing existing test procedures. Beyond automotive NVH, the same scalable architecture can be applied to aerospace components, industrial machinery, and even high-channel-count consumer electronics testing. Expand as Needed, Effortlessly Tackle Any Testing Challenge The flexible expansion capability of SonoDAQ allows it to scale from simple single-channel testing to large-scale multi-channel data acquisition. Whether it's for in-vehicle testing, industrial monitoring, or scientific research, SonoDAQ provides accurate, reliable data acquisition solutions. Its modular design and flexible system topology not only meet current needs but also enable quick adaptation to evolving testing scenarios in the future. Choosing SonoDAQ means moving away from fixed hardware configurations and instead adjusting the system based on needs, ensuring smooth, repeatable execution of every test. SonoDAQ is ready to transform your testing process—from simple single-device setups to large-scale, multi-channel systems. Contact us now: fill out the “Get in touch” form below, and our team will get back to you shortly.

SonoDAQ for Sound & Vibration Testing

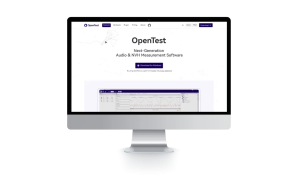
SonoDAQ is the next-generation high-performance data acquisition system, specifically designed for sound and vibration testing. It features a modular architecture, making data acquisition more efficient and precise. From industrial environments to laboratory measurements, SonoDAQ meets the demands of high-precision data acquisition and provides seamless support for multi-channel synchronized data collection. Modular Design, Flexible to Adapt to Various Applications SonoDAQ adopts a completely new modular design, allowing for flexible configuration based on different needs. Whether you require a basic 4-channel setup or a large-scale system with hundreds of channels, SonoDAQ can easily accommodate both. You can select modules according to your project requirements and expand the system at any time, avoiding unnecessary costs. This flexibility is particularly well-suited for dynamic and evolving testing environments. High-Precision Synchronization Ensures the Accuracy of Test Results In sound and vibration testing, data accuracy is crucial. SonoDAQ is equipped with a 32-bit ADC and a sampling rate of up to 204.8 kHz. It ensures time synchronization between channels with a time error of less than 100 ns through PTP (IEEE 1588) and GPS synchronization. This level of synchronization precision allows you to obtain reliable and consistent data results, even in multi-channel, large-scale distributed acquisition systems. Flexible System Expansion with Multiple Network Topologies Another highlight of SonoDAQ is its powerful distributed acquisition capability. With various network connection methods like daisy chain and star topology, multiple devices can be easily integrated into the same acquisition system. Leveraging PTP (Precision Time Protocol) and GPS synchronization technology, SonoDAQ ensures nanosecond-level synchronization, providing data consistency across devices, whether for small-scale laboratory tests or large-scale field data collection. You can choose different system topologies based on your specific needs, offering flexibility for complex testing scenarios. Innovative Structural Design, the Ideal Choice for Field Applications SonoDAQ's frame is made using 5000t aluminum extrusion technology combined with carbon fiber-reinforced plastic, offering exceptional sturdiness while significantly reducing the device's weight. Additionally, SonoDAQ supports PoE power supply and hot-swappable batteries, ensuring efficient operation even in harsh environments and meeting the demands of long-duration continuous acquisition. Whether in the laboratory or on industrial sites, SonoDAQ delivers stable performance. Extensive Signal Compatibility, Expanding Your Testing Boundaries SonoDAQ supports a variety of signal inputs, including IEPE sensors, CAN bus, digital I/O, and other interface protocols. This allows it to meet a wide range of testing needs, from vibration monitoring to motor noise analysis. Whether you're conducting basic data acquisition or advanced signal analysis, SonoDAQ provides the precision and flexibility you require. Enhance Testing Efficiency, Making Data Acquisition Simpler With the accompanying OpenTest software, SonoDAQ allows you to monitor and analyze collected signals in real-time. OpenTest offers an intuitive interface and powerful data analysis features, making it easier to process and present test data. Additionally, SonoDAQ supports open protocols like ASIO and OpenDAQ, facilitating integration with other testing tools or software. SonoDAQ will help streamline your testing process, improve data acquisition efficiency, and provide precise measurements in various complex testing environments. Whether it's noise testing, vibration analysis, or complex sound power measurements, SonoDAQ is your ideal choice. Choose SonoDAQ today and bring revolutionary changes to your testing work! SonoDAQ is ready to transform your testing process — don’t wait to experience its power. Contact us now! Please fill out the 'Get in touch' form below, and we'll get back to you shortly!

SonoDAQ Enclosure Coating Hardness Test

In real DAQ use, enclosure durability and scratch resistance directly affect service life and maintenance cost. This article shares a pencil hardness scratch test on the SonoDAQ top cover (PC + carbon fiber) and compares it with a typical laptop enclosure. The results show how the enclosure performs from 2H to 5H and why the surface finish helps it hold up in daily handling. How Scratch Resistance Affects DAQ Use When choosing a DAQ front end, engineers usually look first at the specs—sample rate, dynamic range, synchronization accuracy, channel count… But after a few years of real use, many realize that enclosure reliability and scratch resistance can be just as important to the system’s service life and day-to-day experience. For soundand vibration test equipment, this is even more obvious. Typical SonoDAQ applications include NVH road tests, on-site industrial measurements, and long-term outdoor or semi-outdoor acquisition, where the device often has to: be carried frequently, loaded into vehicles, or fixed on fixtures or test benches; be moved between lab desks, instrument carts, and tool cases; remain in close contact with other metal equipment, screwdrivers, laptops, and more. In such environments, a housing that scratches easily not only looks worn, but can also drive up maintenance and replacement costs. To better reflect daily handling, we ran a pencil-hardness scratch test on the SonoDAQ front-end upper cover and used a common laptop enclosure as a reference. Test Setup The test was performed strictly in accordance with ISO 15184:2020, and was intended to evaluate the scratch resistance of the UV-cured coating on the outer surface of the SonoDAQ front-end upper cover. Samples SampleDescriptionA — SonoDAQ top coverMaterial: PC + carbon-fiber plate (top/bottom covers), with an internal aluminum frame and corner protection.B — Typical laptop enclosureMaterial: Plastic/metal housing with a sprayed coating. This test follows the pencil hardness test approach. Pencils of different hardness grades were used to scratch the enclosure surface under consistent contact conditions, and the surface was inspected for any scratches visible to the naked eye. Test Tools Pencil hardness tester, additional weights can be added as required. Pencils: hardness grades 2H, 3H, 4H, and 5H. Procedure Insert the pencil into the pencil hardness tester at a 45° angle, with a total load of 750 g (equivalent to applying 7.5 N to the coating surface). For each pencil hardness grade, scratch the enclosure surface three times and check whether any visible scratches appear. Keep the scratch length and applied force as consistent as possible to ensure comparability across hardness grades. Results Criteria Whether visible scratches appear; Whether the surface gloss changes noticeably. Results From the results, we could see that the front-end enclosure showed different levels of scratch resistance under different pencil grades. To further validate durability, we ran the same pencil hardness test on a typical laptop enclosure. Laptop housings are usually plastic or metal and also have a painted surface. We used the same method as for the DAQ unit: 2H Pencil: SonoDAQ ProTypical Laptop Conclusion: Neither the SonoDAQ enclosure nor the laptop enclosure showed any obvious scratches; visually there was almost no change. 3H Pencil: SonoDAQ ProTypical Laptop Conclusion: Neither the SonoDAQ enclosure nor the laptop enclosure showed any obvious scratches; visually there was almost no change. 4H Pencil: SonoDAQ ProTypical Laptop Conclusion: At 4H, the SonoDAQ enclosure still showed no visible scratches; in contrast, the laptop enclosure exhibited clearly visible scuffs, essentially reaching the upper limit of its scratch resistance. 5H Pencil: SonoDAQ Pro Conclusion: At 5H, light scratches began to appear on the SonoDAQ enclosure, indicating it was approaching its scratch-resistance limit. Note that the pencil hardness test is primarily a relative comparison of scratch resistance between enclosures; it does not represent a material’s absolute hardness or long-term wear life. However, for assessing whether a surface is “easy to scratch” in everyday use, it is a very direct method. If we translate the pencil grades into typical real-world scenarios: Accidental rubbing from most keys, equipment edges, and tools usually falls in the 2H-3H range; 4H-5H corresponds to harder, sharper, and more forceful scratching—often with some deliberate pressure. At 4H, the SonoDAQ enclosure is still difficult to mark, and it only shows slight scratching at 5H. This means that during normal handling, loading, installation, and daily use, the enclosure is not easy to scratch. Why It Holds Up The SonoDAQ front-end enclosure uses a PC + carbon-fiber composite, which provides good mechanical strength and toughness. On top of that, the surface is finished with a spray-and-bake paint process plus a UV-cured top layer, which plays a key role in: Increasing surface hardness and improving scratch resistance; Improving corrosion resistance and environmental robustness; Balancing durability with a premium look and feel. For instrumentation, “harder” is not always “better.” The right design balances scratch resistance, impact resistance, weight, and long-term reliability. As the results show, SonoDAQ’s enclosure is durable enough for real-world use. For more information on SonoDAQ features, application scenarios, and typical configurations, please fill out the Get in touch form below to contact the CRYSOUND team. We will provide selection recommendations and support based on your test requirements.

Get in touch

If you are interested or have questions about our products, book a demo and we will be glad to show how it works, which solutions it can take part of and discuss how it might fit your needs and organization.

Support Support
Product Catalogs Product Catalogs Solutions Solutions User Manuals User Manuals Software Download Software Download Product Inquiry Product Inquiry Schedule Demo Schedule Demo Technical Support Technical Support +86-571-88225128 +86-571-88225128
Request Quote 0
Request Quote
This site is registered on wpml.org as a development site. Switch to a production site key to remove this banner.