
Free Shipping
Payment Methods
Product Highlights
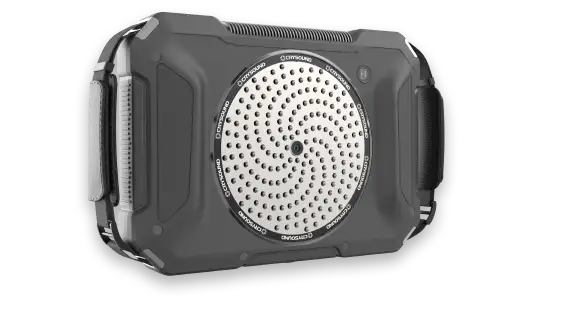
The Best Performance in the Industry
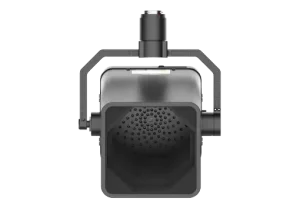
With 200 microphones, 100kHz bandwidth, and the fastest processor in the industry, the CRY8124 can pinpoint smaller leaks and partial discharges at a greater distance than any other system.
CRY8124 keeps operators at a much safer distance, avoiding exposure to toxic gases. Also, benefiting from the increased detection distance, the camera covers a wider area, improving test efficiency by more than 4x.
Detects leaks at twice the distance of 1st gen
Locates 2.7bar 0.0029L/min leak at 10m distance
Doubles the Detectability of Sound Sources in Noisy Environments
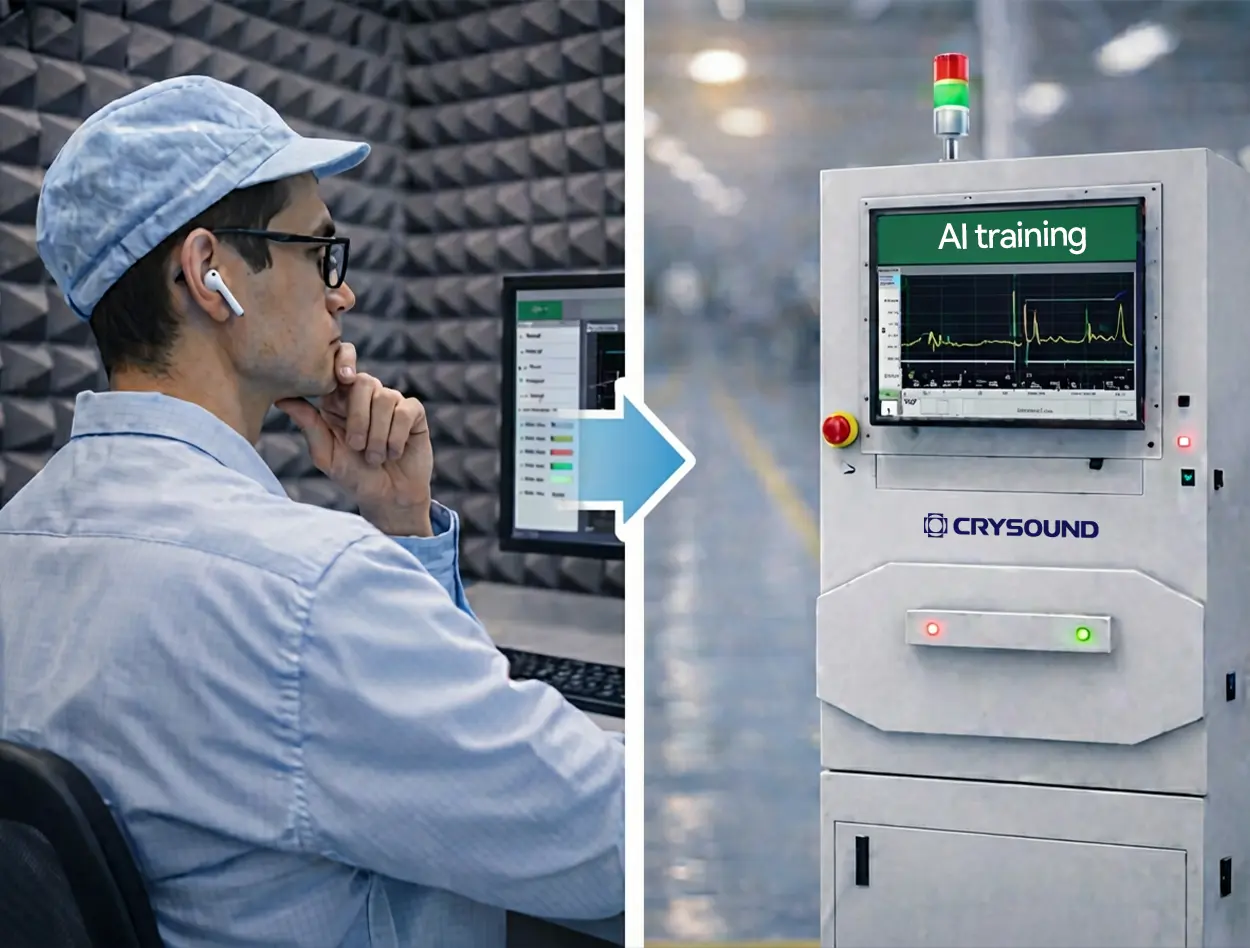
In most field inspections, background noise is always the biggest concern that limits the performance of acoustic imaging cameras. With the CRY8124, we have introduced a new powerful algorithm, 'HyperVision.'
HyperVision mitigates mutual interference between different sources. The signals of the target sound source are emphasized, and previously unrecognized sound sources are accurately identified and presented.
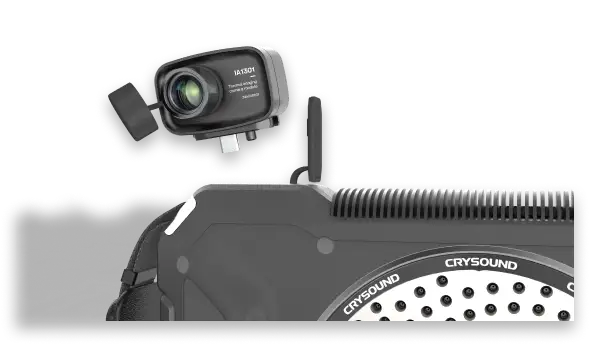
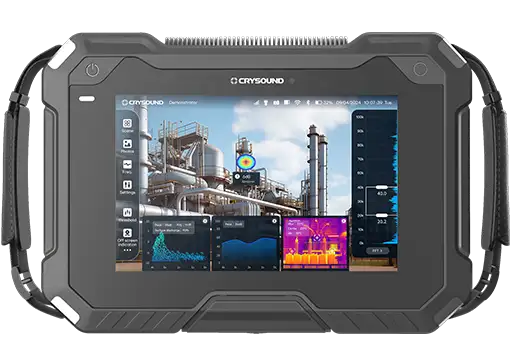
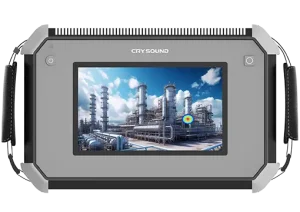
Thermal & Acoustic Imaging Display Simultaneously
Integrating infrared technology with an acoustic camera significantly boosts its capabilities and efficiency. This combination enables real-time, simultaneous visualization of both thermal and acoustic images, ensuring that no detail goes unnoticed. By eliminating the need for separate thermal and acoustic inspections, it streamlines workflows and enhances overall inspection efficiency. This integration is especially valuable in high-temperature scenarios, such as with steam traps, where precise temperature measurement aids in informed decision-making.
Resolutions of 640×512 and 384×288 available
Measurement range from -20 to 500℃
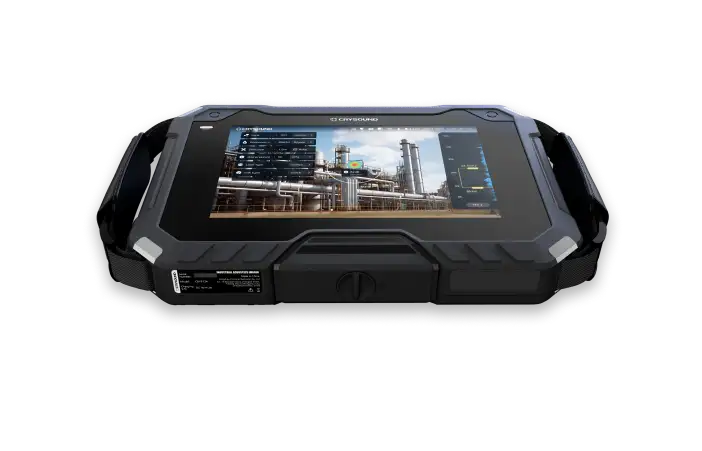
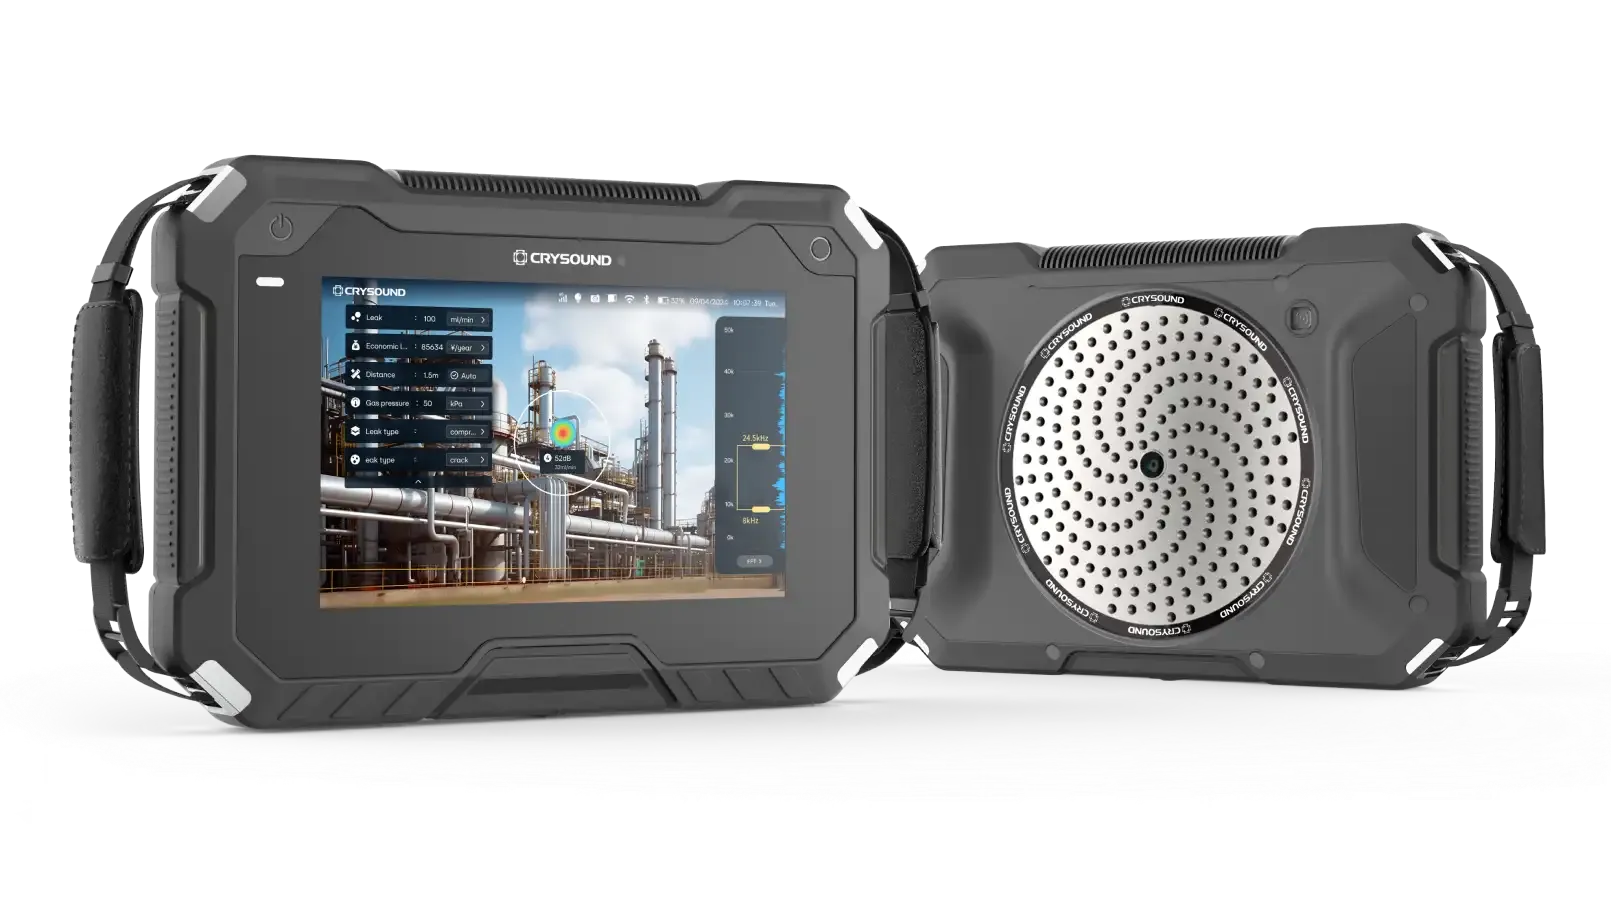
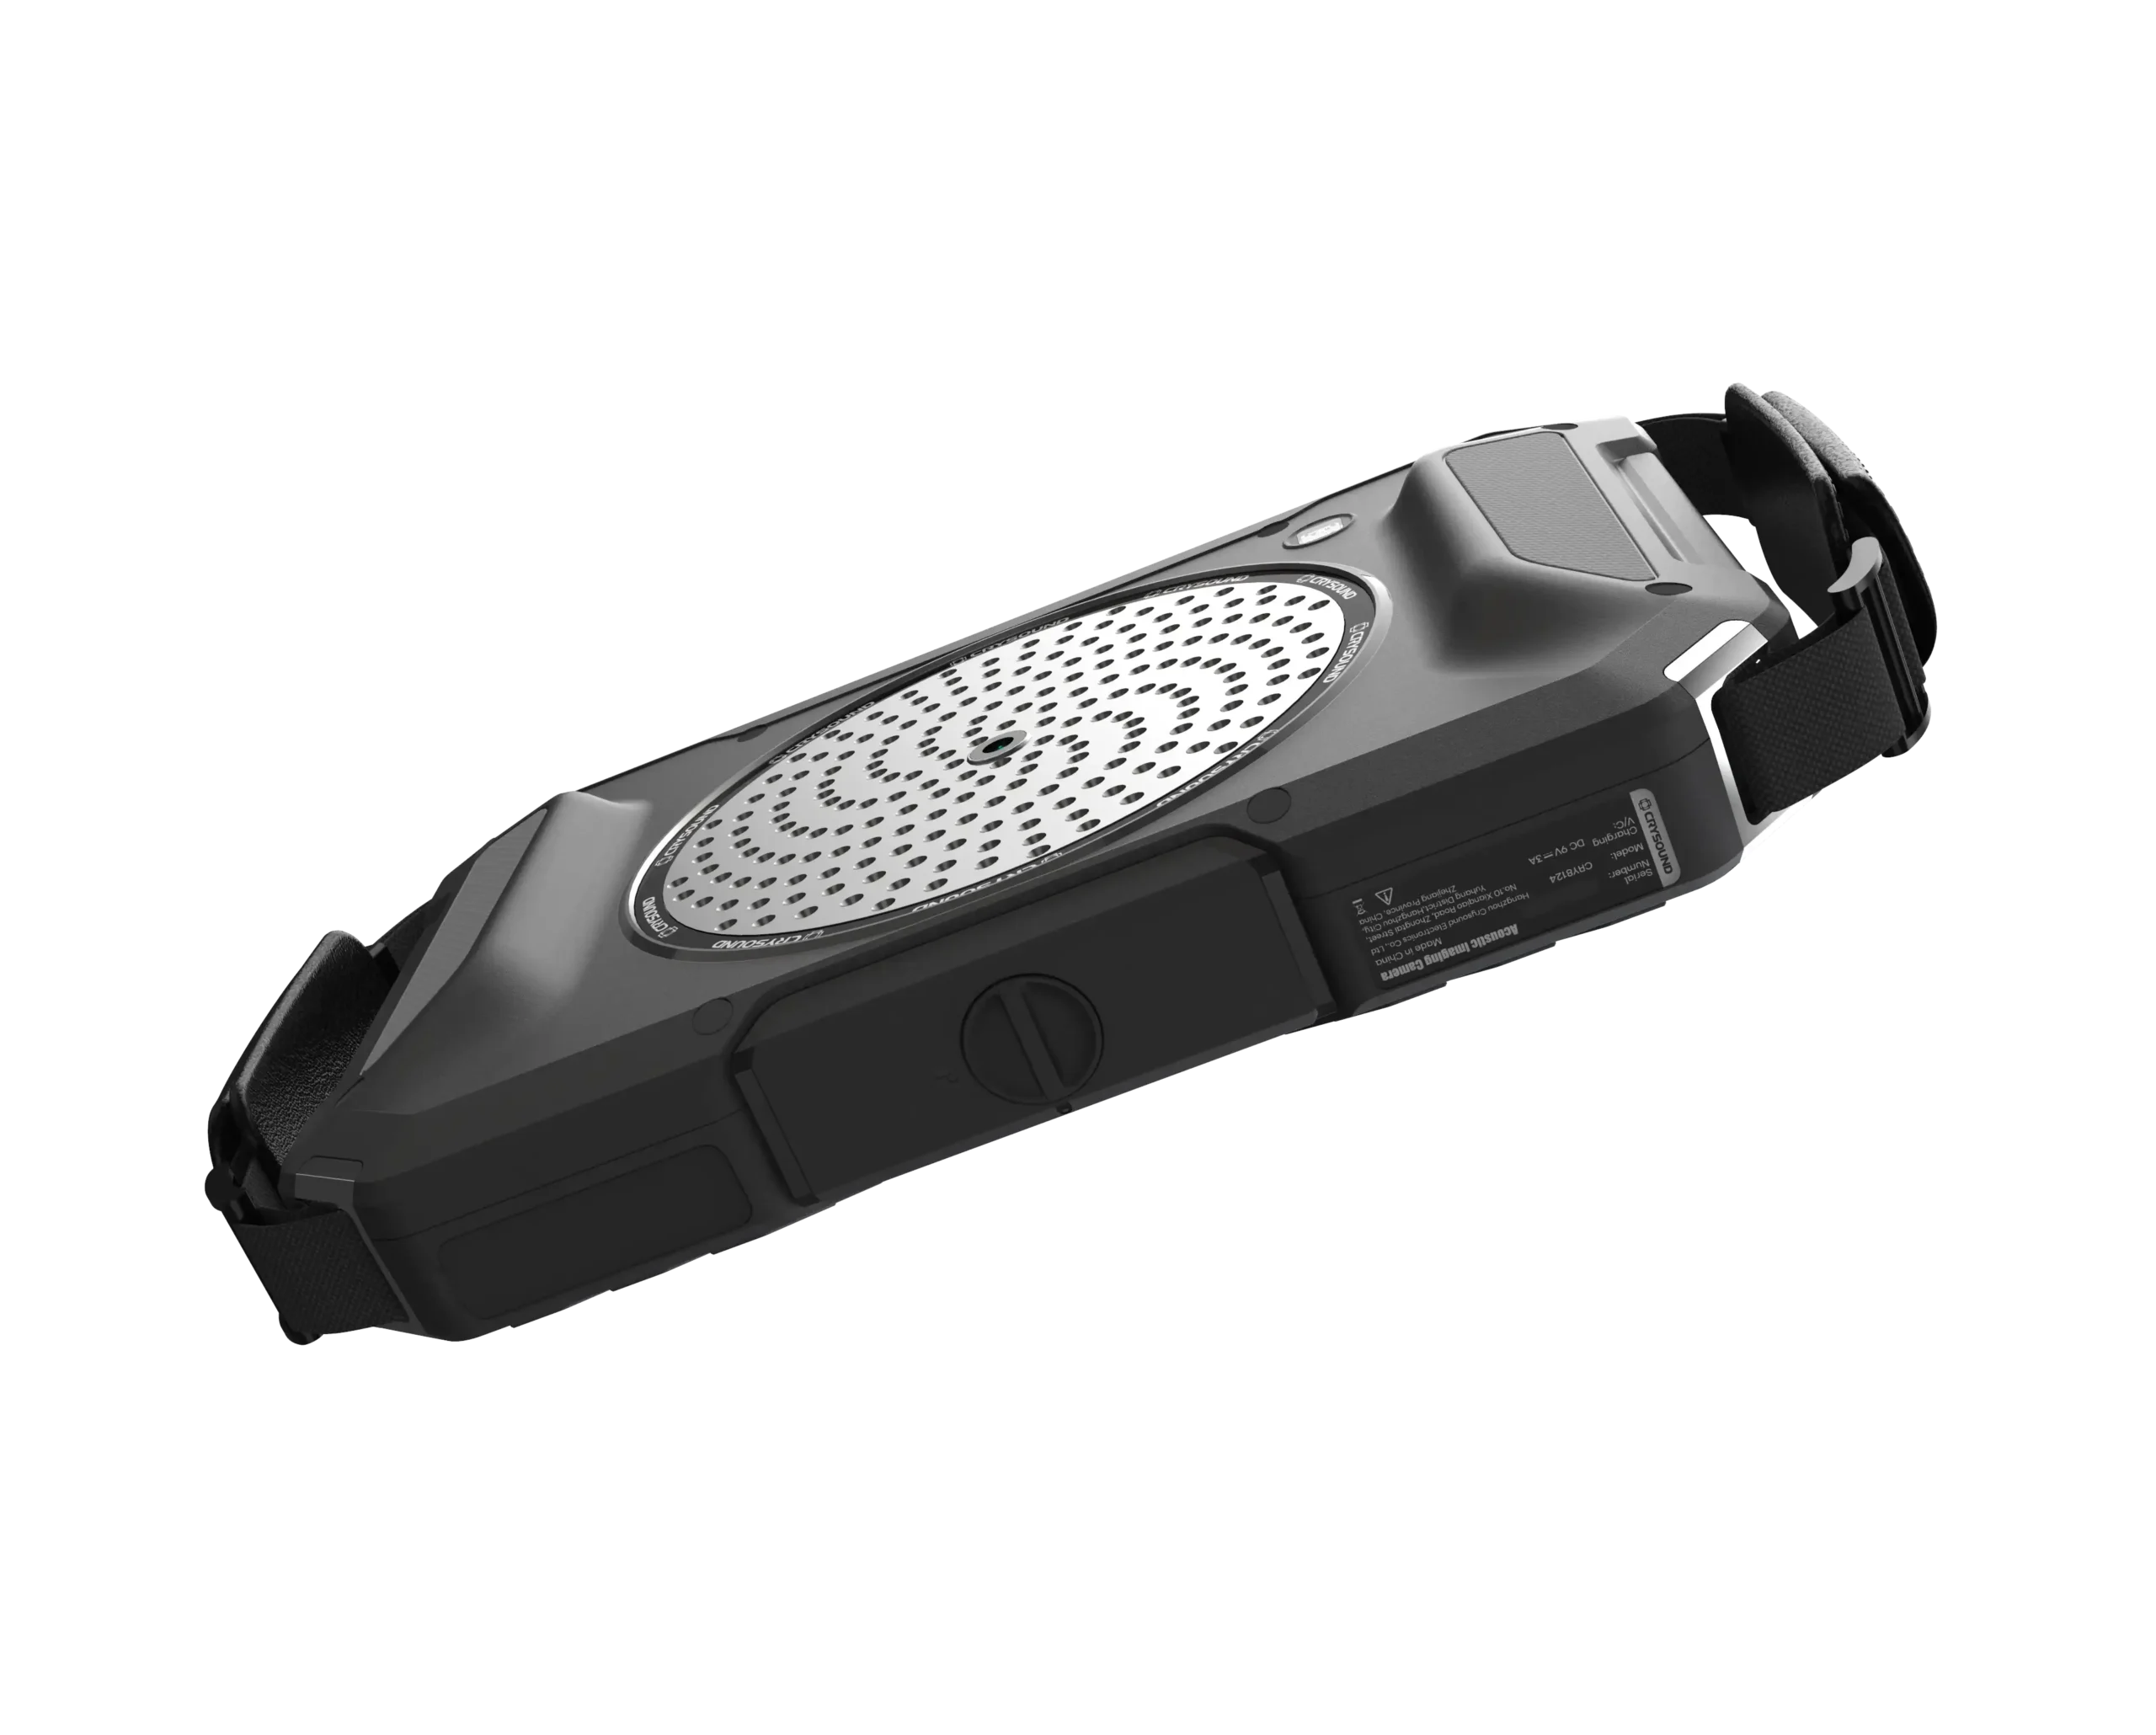
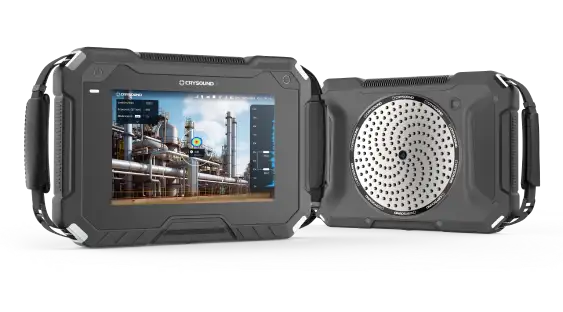
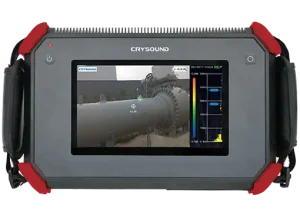
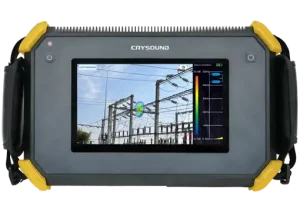
Ergonomic Design & Premium Display
Weighing just 3 lbs (1.4 kg), this device is encased in a high-quality soft rubber coating that provides an excellent tactile feel and ensures a secure grip. The ergonomically designed handle enables comfortable single-handed operation, enhancing user convenience and safety in various scenarios.
The display features a stunning 8-inch LCD screen with a resolution of 1920x1200, delivering sharp, detailed visuals. With a brightness of 600 nits, the screen remains easily readable even in direct sunlight, ensuring reliable performance across different lighting conditions.
Rubber molded and weight only 3 lbs (1.4kg)
1920x1200, 8-inch LCD Display
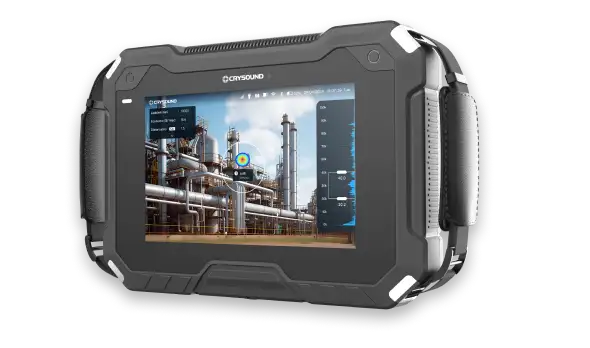
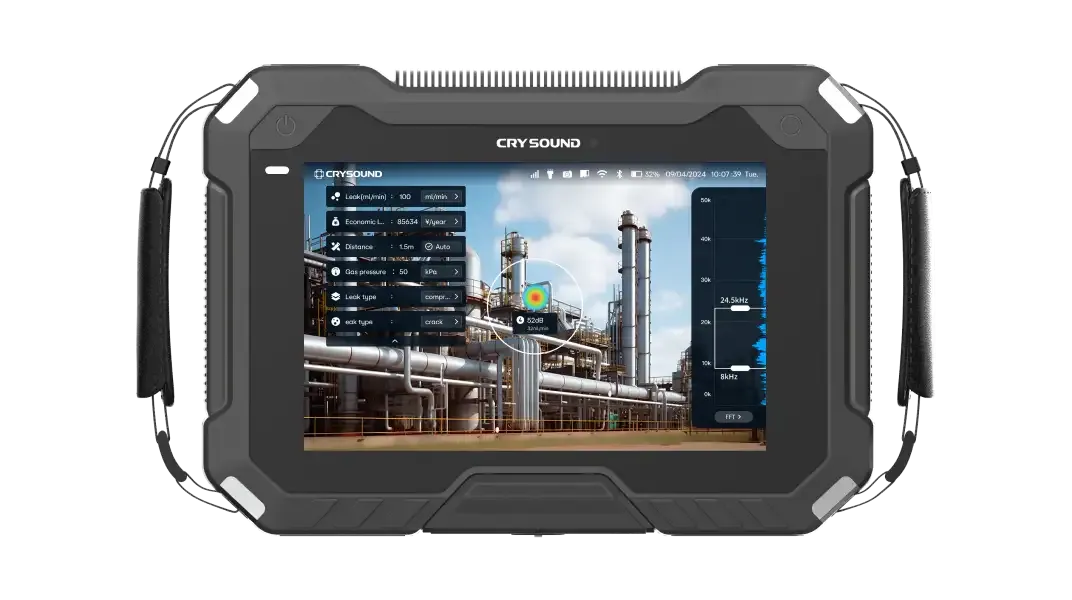
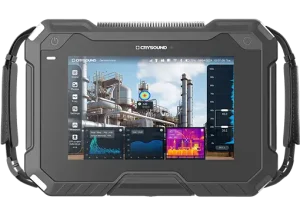
New Software for Leak Detection & Partial Discharge (PD)
The CRY8124 acoustic imaging camera boasts a fully revamped software interface that simplifies the detection of gas and vacuum leaks, partial discharge (PD) localization, and PD type identification. This user-friendly interface enables operators to swiftly and accurately identify the sources of leaks, minimizing downtime and boosting operational efficiency. Additionally, its advanced PD detection features provide precise localization and classification of partial discharge types, ensuring the reliability and performance of electrical assets.
Locates and quantifies gas/vacuum leaks
Pinpoints PD and recognizes the type of PD
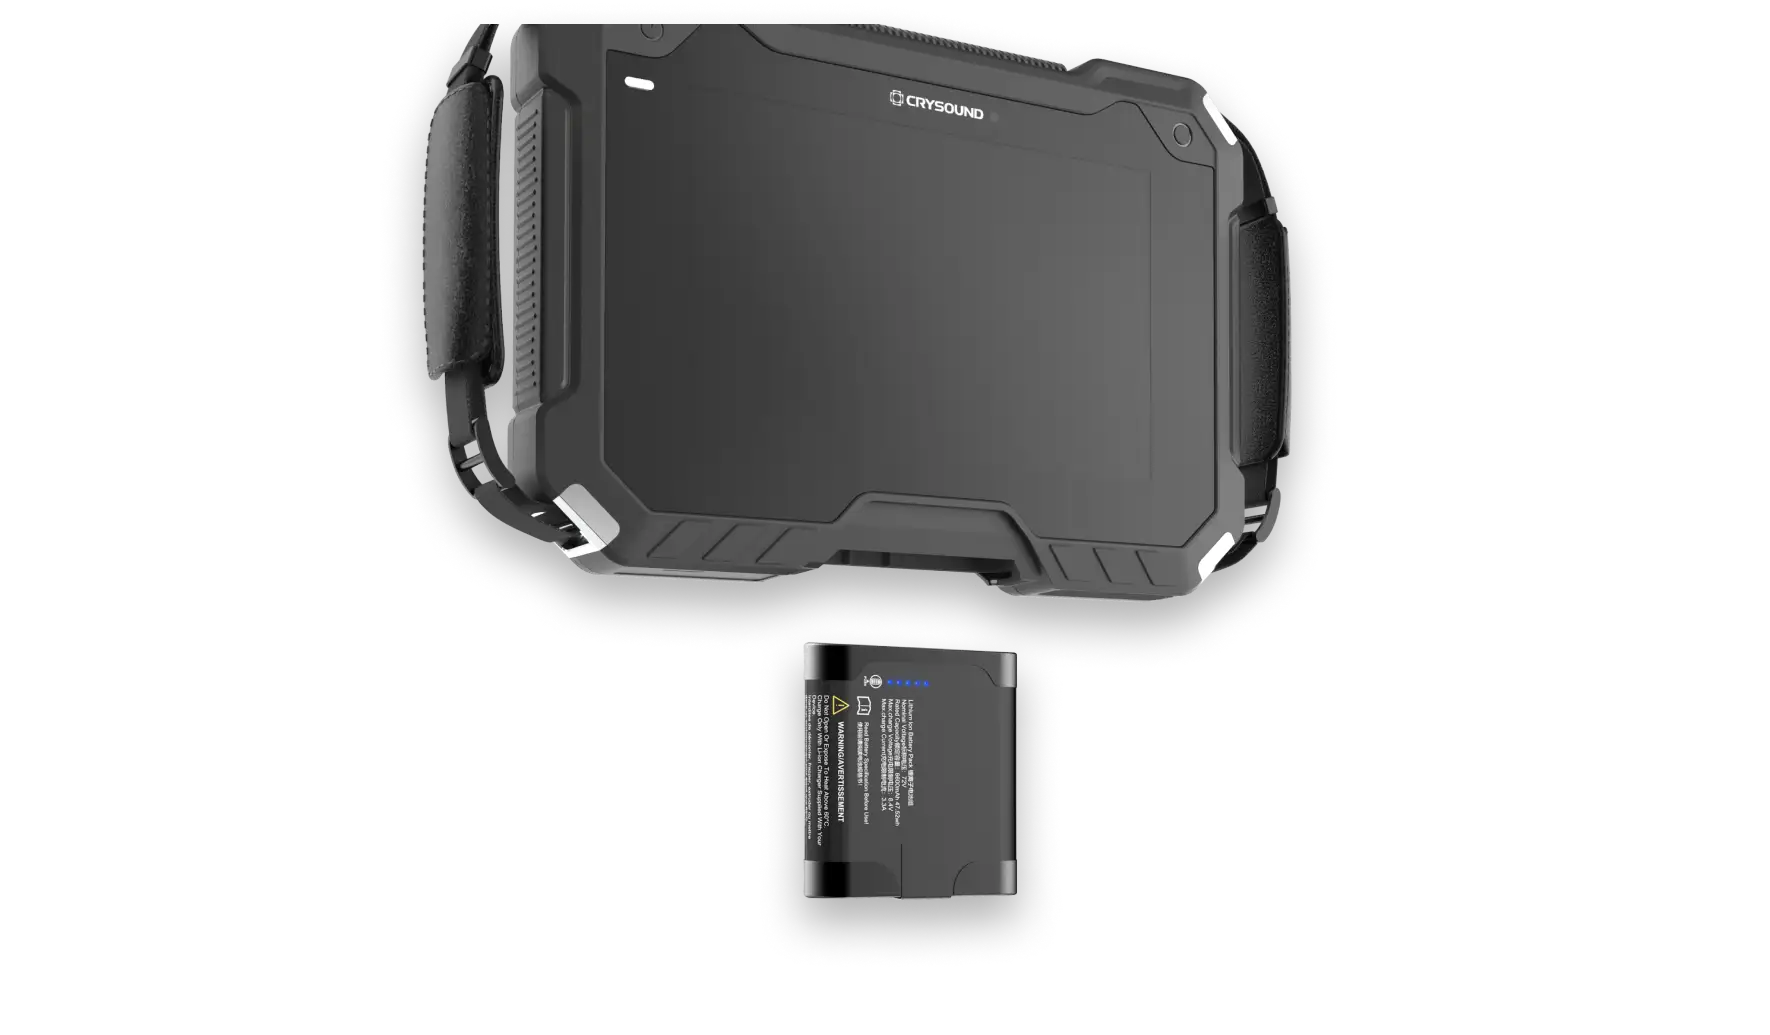
Up to 10 Hours of Operation with Replaceable Battery
The CRY8124 acoustic imaging camera comes with advanced smart replaceable batteries, enhancing convenience and extending operational time. Each battery provides up to 5 hours of continuous use, ensuring uninterrupted inspections.
With an extra spare battery included, the device supports a full day of testing. The standard package features two smart batteries and a smart battery charger for effortless battery management. LED indicators on each battery show the current charge level, allowing users to easily monitor battery status and plan their work efficiently.
Enhancing Efficiency with Bluetooth®& Wi-Fi Connectivity
With Bluetooth® connectivity, users can pair wireless headsets with the camera, avoiding the risks associated with wired headsets in busy industrial environments. This feature also enables seamless data transfer to smartphones, facilitating rapid and efficient sharing of inspection data with enterprise applications. Additionally, Wi-Fi capability enhances the camera’s versatility by allowing easy data transfer to PC-based reporting software.
Connect to Bluetooth headphones and phone apps
Transfer data to PC wirelessly
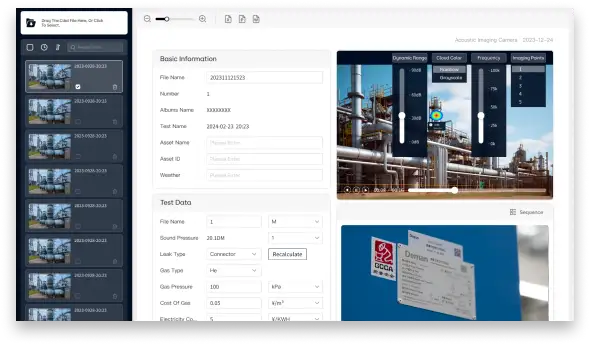
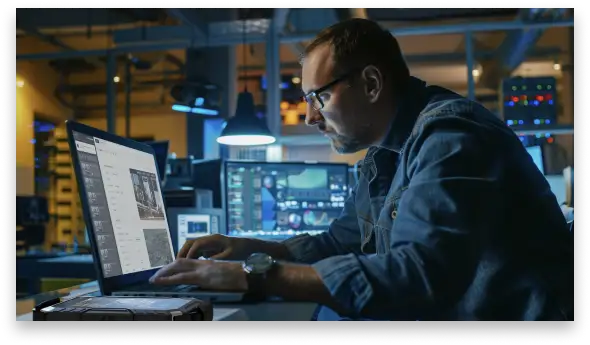
Advanced Reporting Software
The CRY8124 acoustic imaging camera is paired with advanced reporting software that significantly enhances user experience and efficiency. The software boasts a newly redesigned, intuitive interface, making navigation and operation easier than ever. Wireless data transfer capabilities allow users to seamlessly send inspection data from the camera to the software, eliminating the hassle of cables. Additionally, the software supports infrared data analysis and provides powerful tools for data post-processing, enabling comprehensive investigations and the creation of detailed reports.
Redesigned user interface
Wireless data transfer
Generates reports for acoustics and infrared data
CRY2626G Drone-Mounted Acoustic Imaging Camera
CRY2623M Fixed Acoustic Imaging Camera
CRY2624 128-Mic Industrial Acoustic Imaging Camera (ATEX)
CRY2620 64-Mic Industrial Acoustic Imaging Camera
CRY2623 128-Mic Industrial Acoustic Imaging Camera
CRY8500 Series SonoCam Pi Acoustic Camera
CRY8124 Advanced Acoustic Imaging Camera