Measure Sound Better


Blogs
The Microphone That Goes Where Others Can't. 1/2" Prepolarized Free-Field | IP67 | –50°C to +125°C | Built for the Real World The Problem With Traditional NVH Microphones Every NVH engineer knows the frustration: you need accurate acoustic data, but the test environment is anything but laboratory-perfect. Rain. Dust. Engine bay heat at 120°C. Scandinavian winter at –40°C. Vibration. Shock. Road spray. Traditional measurement microphones weren't built for this. They're precision instruments designed for controlled environments — fragile, temperature-sensitive, and one drop away from an expensive recalibration. So engineers compromise: they protect the microphone instead of optimizing the measurement, or they accept degraded data from sensors pushed beyond their limits. CRY3213 changes this equation entirely. A Game Changer for NVH Testing The CRY3213 is the first NVH measurement microphone that delivers laboratory-grade accuracy in the harshest real-world conditions — without compromise, without babysitting, without excuses. What You Get What It Means –50°C to +125°C operating range Test in Arctic cold or next to a turbo manifold — same accuracy, same reliability IP67 dust & water protection Full immersion protection. Rain, road spray, pressure washing — it keeps measuring Ruggedized, vibration-resistant design Survives the shocks and vibrations of real-world vehicle testing without signal degradation 50 mV/Pa sensitivity High output for excellent signal-to-noise ratio, even in quiet cabin measurements 3.15 Hz – 20 kHz (±2 dB) Full audible bandwidth plus infrasound — captures everything from tire cavity resonance to HVAC hiss This isn't an incremental improvement. It's a new category: the ruggedized precision NVH microphone. Why CRY3213 Is Different 1. Extreme Temperature Performance Most measurement microphones spec a conservative operating range: 0°C to 50°C, maybe –10°C to 60°C with reduced performance. That's fine for a lab. It's useless for: Cold climate testing in Arjeplog, Sweden (–35°C) or Northern China (–40°C) Under-hood measurements where temperatures routinely exceed 100°C near exhaust manifolds and turbochargers Thermal cycling tests that swing from frozen to furnace in minutes CRY3213 operates at –50°C to +125°C with specified accuracy. No warm-up drift. No thermal shutdown. No recalibration needed between temperature extremes. When your competitors are swapping frozen microphones in the parking lot, your CRY3213 is still collecting data. 2. IP67: Truly Weatherproof IP67 means: - 6 = Total dust ingress protection (dust-tight) - 7 = Protected against temporary immersion in water (up to 1 meter, 30 minutes) For NVH testing, this translates to: - Pass-by noise testing in rain — no test cancellations, no scrambling for covers - Road spray and puddle testing — mount microphones at wheel height without worry - Tropical humidity environments — no condensation-related signal drift - Outdoor long-term monitoring — deploy and forget Most competitors either lack IP ratings entirely or max out at IP55 (limited dust/splash protection). CRY3213's IP67 is the highest protection class available in a precision NVH microphone. 3. Ruggedized and Vibration-Resistant Traditional condenser microphones are delicate by nature — thin diaphragms, precision air gaps, tight tolerances. The CRY3213 is engineered differently: Shock-resistant construction — survives drops, bumps, and the everyday abuse of field testing Power-on LED indicator — instant visual confirmation that the microphone is active and powered Vibration-isolated design — rejects mechanical vibration that would contaminate acoustic measurements on engine test benches and vehicle structures Robust cable and connector — designed for repeated connect/disconnect cycles in field conditions This means you can mount it on the vehicle, not just near it. Engine mounts, chassis rails, wheel arches — places where traditional microphones would fail from vibration alone. 4. No-Compromise Acoustic Performance Ruggedized doesn't mean reduced performance. CRY3213 delivers: Sensitivity: 50 mV/Pa (–26 dB re 1V/Pa) — matching premium lab microphones Frequency Response: 3.15 Hz to 20 kHz (±2 dB) — the full NVH bandwidth Dynamic range up to 136 dB — handles everything from quiet cabin to high-SPL engine bay measurements Low-frequency extension to 3.15 Hz — critical for tire cavity resonance (180–250 Hz), body boom (30–60 Hz), and powertrain low-order vibrations Prepolarized design — no external polarization voltage needed; plug-and-play with any IEPE/CCP input Application Scenarios Automotive NVH — Where CRY3213 Shines Application Environment Why CRY3213 Powertrain Noise Engine bay, 80–120°C, heavy vibration Temperature range + vibration resistance Road Noise Testing Outdoor, all weather, road spray IP67 + wide temperature range Wind Noise Testing Wind tunnel or outdoor, high airflow Ruggedized + dust protection Pass-by Noise (ISO 362) Outdoor, rain or shine, year-round IP67 enables all-weather testing Cold Climate Validation Arctic conditions, –30°C to –50°C –50°C low-end operating range EV Motor Whine Analysis Near e-drive, electromagnetic interference High sensitivity + vibration isolation Squeak & Rattle Interior, door panels, dashboard Full bandwidth down to 3.15 Hz Production Line EOL Test Factory floor, dust, temperature swings IP67 + rugged design for 24/7 industrial use Beyond Automotive CRY3213's extreme environmental specs make it equally valuable in: Aerospace: Engine run-up testing, cabin noise certification, flight testing Rail: Exterior and interior noise measurements per EN/ISO standards Heavy Industry: Turbine noise monitoring, compressor testing, outdoor environmental noise Energy: Wind turbine noise assessment in extreme weather conditions CRY3213 vs. The Competition How does CRY3213 stack up against the industry's most common NVH microphones? Feature CRY3213 B&K Type 4189 GRAS 46AE Temperature Range –50°C to +125°C –10°C to +50°C –10°C to +50°C IP Rating IP67 Not rated Not rated Vibration Resistance Yes (ruggedized) No No Sensitivity 50 mV/Pa 50 mV/Pa 50 mV/Pa Frequency Range 3.15 Hz – 20 kHz 6.3 Hz – 20 kHz 3.15 Hz – 20 kHz Size (1/2") ✅ ✅ ✅ Prepolarized ✅ ✅ ✅ Warranty 10 years 2 years 2 years All-Weather Field Use Yes Limited Limited The bottom line: Same precision. Same sensitivity. Dramatically more capable in real-world conditions. And backed by a 10-year warranty that says we stand behind it. Technical Specifications Parameter Value Type 1/2" Free-field, Prepolarized IEC Standard IEC 61094 WS2F Sensitivity (±2 dB) 50 mV/Pa, –26 dB re 1V/Pa Frequency Response (±2 dB) 3.15 Hz – 20 kHz Dynamic Range (re. 20 µPa) xx dB(A) – 136 dB Capacitance @250 Hz 15 pF Maximum Output Voltage > 8.0 V Power Supply IEPE (2–20 mA) Connector BNC Operating Temperature –50°C to +125°C Storage Temperature –25°C to +70°C Operating Humidity 0–90% RH, non-condensing IP Rating IP67 (dust-tight, waterproof) Dimensions (with grid) Ø14.5 mm × 92 mm Polarization 0 V (prepolarized) Note: Weight TBC. Frequently Asked Questions Q: Can I use CRY3213 with my existing NVH data acquisition system? A: Yes. CRY3213 is a prepolarized (0V) IEPE/CCP microphone, compatible with any standard constant-current input — including systems from Siemens (SCADAS), HBK (LAN-XI), Dewesoft, National Instruments, HEAD acoustics, and others. Q: How does it handle rapid temperature changes during thermal cycling tests? A: CRY3213 is designed for continuous operation across its full –50°C to +125°C range, including rapid transitions. The thermal compensation ensures sensitivity stability without requiring recalibration between temperature extremes. Q: Is it suitable for permanent outdoor installation? A: Yes. With IP67 protection, CRY3213 is suitable for long-term outdoor deployment. For extended installations, we recommend using the optional outdoor windscreen accessory to minimize wind-induced noise. Q: What's the advantage over array microphones for NVH? A: Array microphones (MEMS-based) offer cost advantages for large-channel setups but typically have narrower dynamic ranges and less environmental protection. CRY3213 provides IEC 61094-compliant precision for reference-quality measurements in conditions where array microphones can't survive. Q: 10-year warranty — what does it cover? A: CRYSOUND's 10-year warranty covers manufacturing defects and sensitivity drift beyond specification. It's one of the longest warranties in the measurement microphone industry, reflecting our confidence in CRY3213's long-term reliability. Ready to Upgrade Your NVH Testing? Stop compromising between precision and durability. CRY3213 delivers both. Request a Quote → Download Datasheet (PDF) → Compare All CRYSOUND Microphones →
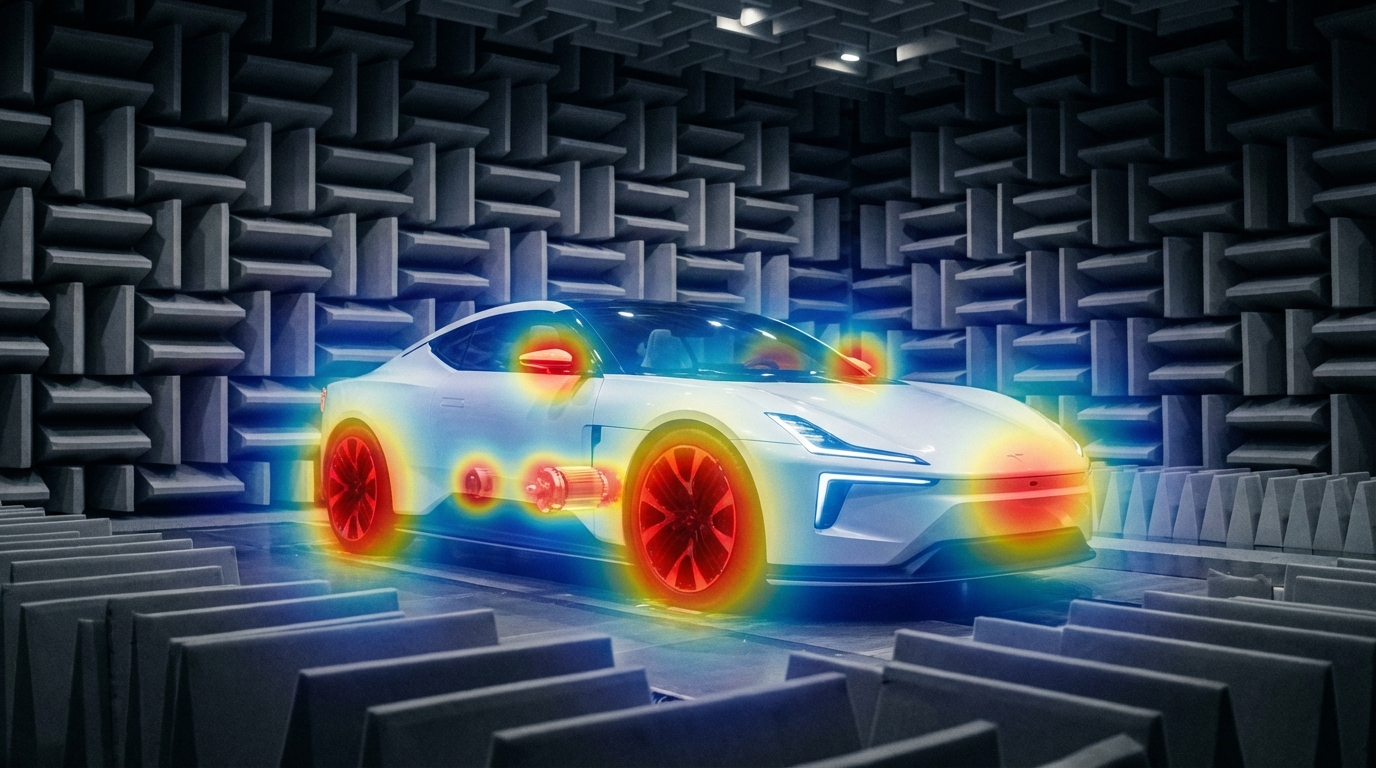
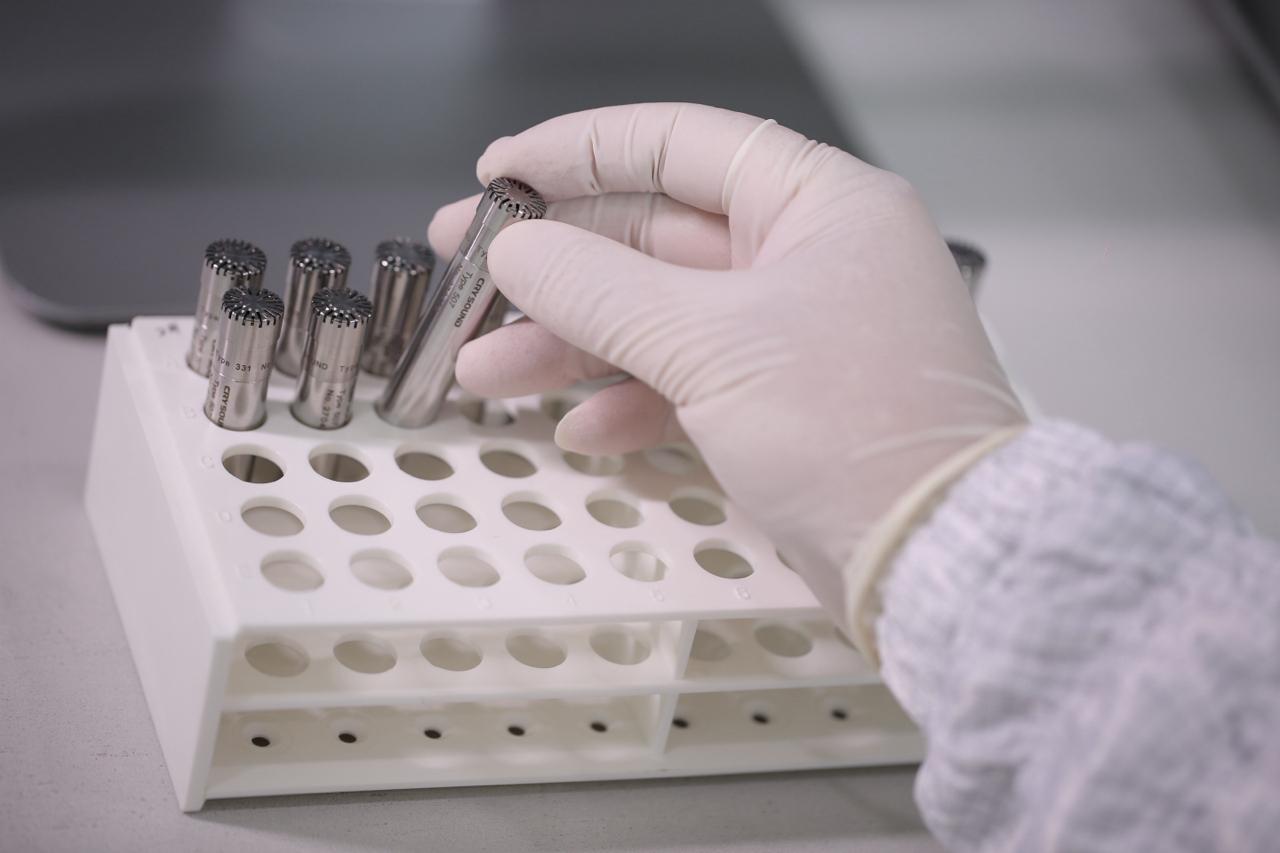
The Quiet EV Paradox: Why Electric Cars Are Actually "Noisier" It sounds like a paradox — electric vehicles have no roaring engine, yet engineers are finding it harder than ever to achieve a truly quiet cabin. The truth is, when the low-frequency masking effect of the internal combustion engine disappears, every previously hidden noise becomes fully exposed: the high-frequency whine of the electric motor, the electromagnetic hum of the inverter, gear meshing vibrations, wind noise, road noise, even the squeak and rattle of interior trim — nothing can hide anymore. This isn't just a comfort issue. It's fundamentally redefining the automotive industry's approach to NVH (Noise, Vibration, and Harshness) testing. The global automotive NVH testing market is projected to grow from USD 3.51 billion in 2026 to USD 5.75 billion by 2034, at a CAGR of 6.4%. The core driver behind this growth? The electrification revolution. What New Noise Challenges Do EVs Bring? A Fundamental Shift in Frequency Range Traditional ICE vehicle NVH work focuses on the 20–2,000 Hz low-frequency range — engine firing, exhaust systems, crankshaft vibrations. Electric vehicles are fundamentally different: Noise Source Typical Frequency Range Characteristics Electric motor electromagnetic noise 500–5,000 Hz Sharp tonal noise, varies linearly with speed Inverter switching noise 4,000–10,000+ Hz High-frequency hum, related to PWM frequency Gear meshing noise 800–3,000 Hz Particularly prominent in single-speed reducers Battery charger noise 8,000–20,000 Hz Near-ultrasonic range, at the edge of human perception Wind / Road noise 200–4,000 Hz Highly exposed without engine masking ICE vs EV: The fundamental shift in noise frequency characteristics Key insight: EV noise problems shift from low frequencies to mid-high frequencies (and even ultrasonic ranges). The 100Hz-5kHz range is where most critical NVH issues reside—precisely where human hearing is most sensitive. Traditional NVH testing methods and frequency ranges may no longer be sufficient. New Noise Sources, New Localization Challenges In the ICE era, the assumption that "the engine is the dominant noise source" made things relatively straightforward. In EVs, noise sources become more distributed and complex: Electric drive system: The motor + inverter + reducer form a highly coupled noise system Thermal management: Battery cooling pumps and fans become dominant noise sources at low speeds Regenerative braking: Changes in inverter operating modes during energy recovery produce transient noise Structural transmission paths: Lightweight body structures (aluminum alloy, carbon fiber) have fundamentally different sound insulation characteristics compared to traditional steel This means engineers face a core challenge: How do you quickly and accurately locate the root cause among multiple distributed, dynamically changing noise sources? Sound Quality Design: From "Reducing Noise" to "Crafting Sound" NVH engineering in the EV era is no longer just about "minimizing noise." Consumers expect a carefully designed sound experience: Acceleration should feel "high-tech" without being harsh The cabin should be quiet, but not so silent that it makes the driver uneasy Different driving modes (Sport / Comfort / Eco) should deliver differentiated acoustic feedback This demand for "Sound Design" is expanding NVH testing from pure engineering validation into subjective sound quality evaluation and brand-level acoustic identity. Why Acoustic Cameras Are Becoming Essential for EV NVH Facing these new challenges, traditional NVH testing tools — single-point microphones, accelerometers — remain important but are no longer sufficient for every scenario. Acoustic cameras are filling this gap. Core Advantages of Acoustic Cameras 1. Real-Time Noise Source Visualization Traditional methods require densely placing microphone arrays on the target object — time-consuming and labor-intensive. Acoustic cameras use beamforming technology to generate a noise source heatmap in a single capture, instantly showing "where the noise is and how loud it is." Typical scenario: An EV prototype running on a test bench, the acoustic camera aimed at the electric drive system, instantly revealing that an 800 Hz resonance originates primarily from the right side of the motor — the entire localization process takes less than 5 minutes. Engineer conducting noise source localization test Automotive NVH detection and optimization 2. Wide Frequency Coverage EV noise spans from hundreds of hertz (gear meshing) to tens of thousands of hertz (inverter switching noise) — an enormous frequency range. Critical consideration for NVH: Most EV noise issues occur in the 100Hz-5kHz range—gear meshing, motor electromagnetic noise, wind leaks, HVAC systems. Traditional acoustic imaging cameras (limited to frequencies above 5 kHz) cannot capture these noise sources. Take the CRYSOUND SonoCam Pi (CRY8500 Series) as the ideal example: its 208 MEMS microphone array provides: Beamforming frequency range: 400 Hz - 20 kHz (covers the entire NVH audible spectrum) Near-field acoustic holography range: 40 Hz - 20 kHz (captures low-frequency road noise and structural vibration) Array size: >30 cm (optimized for low-frequency spatial resolution) This makes SonoCam Pi uniquely suited for full-spectrum EV NVH testing—from low-frequency road noise to high-frequency motor whine, all in a single handheld device. 3. Non-Contact Measurement EV electric drive systems are highly integrated and spatially compact. The non-contact measurement approach of acoustic cameras means: No disassembly of any components required No interference with the operating state of the system under test Rapid quality inspection directly on the production line 4. Portability Modern handheld acoustic cameras like the SonoCam Pi can be taken directly to proving grounds, production lines, or customer sites, no complex setup required. Typical Application Scenarios in EV NVH Scenario Application E-drive system NVH Locating order-based noise contributions from motors, inverters, and reducers Pass-by noise testing Analyzing noise source distribution as vehicles pass by Interior squeak & rattle tracking Locating noise from dashboards, doors, seats, and trim End-of-line production QC Rapid online detection of abnormal noise, replacing subjective human judgment Wind tunnel / Semi-anechoic chamber High-precision noise source localization and sound power analysis Real-World Case Study: OEM Dynamic Road Testing Client: A leading Chinese OEMLocation: An OEM test center, internal test trackObjective: Identify in-cabin noise sources during dynamic driving conditions CRY8500 Series SonoCam Pi acoustic cameras Test Setup Device:SonoCam Pi acoustic camera Measurement positions:Rear seat and front passenger seat Target areas:Left and right B-pillars (rear cabin area) Test mode:Beamforming app Frequency range:3,550 Hz - 7,550 Hz Dynamic range:5 dB Key Results SonoCam Pi successfully localized noise sources in real-time during vehicle motion, providing actionable data for OEM's NVH engineering team. The test demonstrated: Real-time localization during dynamic conditions: Unlike fixed laboratory setups, SonoCam Pi captured noise distribution while the vehicle was in motion on the test track Precise frequency-band analysis: By focusing on the 3,550-7,550 Hz range (critical for perceived cabin noise), engineers pinpointed specific contributors rather than measuring overall SPL Rapid testing workflow: Complete B-pillar area scan in minutes, not hours Noise Source Localization Results Key Insight: Traditional microphone arrays would require the vehicle to be stationary in a semi-anechoic chamber. SonoCam Pi enabled on-track diagnostics, dramatically reducing testing time and enabling rapid iteration during vehicle development. Future Trends — What's Next for EV NVH Testing? AI-Driven Noise Classification Machine learning is being integrated into NVH testing workflows: automatically identifying noise types, determining whether anomalies exist, and predicting potential quality issues. The high-dimensional data captured by acoustic cameras is naturally suited for AI analysis. Digital Twins and Simulation-Test Integration Simulation (CAE) predicts noise performance → Acoustic camera validates through physical measurement → Data feeds back to optimize the simulation model. This closed-loop approach is becoming the standard workflow for major OEMs. New Challenges in the Solid-State Battery Era Solid-state batteries have different mechanical properties compared to liquid lithium-ion batteries. Their vibration transmission characteristics and thermal management approaches will introduce new NVH challenges. Stricter Regulations Pass-by noise testing is the fastest-growing NVH sub-segment (CAGR 7.11%), with UNECE pushing for stricter standardized testing requirements, including indoor pass-by testing protocols. Conclusion: The Value of Acoustic Testing, Redefined for the EV Era Electrification hasn't made cars quieter — it has made noise challenges more complex, more nuanced, and more valuable to solve. For automotive OEMs, Tier 1 suppliers, and testing service providers, investing in the right NVH testing equipment is no longer a "nice-to-have" — it's foundational infrastructure for competitiveness. Acoustic cameras—especially those capable of capturing the critical 100Hz-5kHz NVH frequency range—are evolving from "useful auxiliary tools" to "indispensable standard equipment." The CRYSOUND SonoCam Pi stands out as the only handheld acoustic camera that combines: Low-frequency capability (400 Hz beamforming, 40 Hz holography) High spatial resolution (208 microphones, >30 cm array) Near-field + far-field measurements in a single system Portability (handheld, <3 kg, production-ready) Learn more: CRYSOUND SonoCam Pi (CRY8500 Series) → Contact us for NVH testing solutions →
A measurement microphone is not just any microphone — it is a precision acoustic sensor designed for traceable, repeatable sound pressure measurement. This guide covers how they work, the different types available, key specifications to compare, and how to select the right one for your application. What Is a Measurement Microphone? A measurement microphone is a high-precision acoustic transducer engineered to convert sound pressure into an electrical signal with known accuracy. Unlike studio or consumer microphones that are designed to make audio "sound good," a measurement microphone is designed to be truthful — its output must faithfully represent the actual sound pressure at the measurement point. The defining characteristics of a measurement microphone include: Known, stable sensitivity (expressed in mV/Pa) that can be traced to national or international standards Flat, well-characterized frequency response under defined sound-field conditions Wide dynamic range with low distortion from noise floor to maximum SPL Traceable calibration using pistonphones or acoustic calibrators Environmental stability — minimal drift due to temperature, humidity, and atmospheric pressure changes In practical terms, a measurement microphone is the front-end sensor of a metrology-grade measurement chain. Every specification — from the data acquisition system to the analysis software — depends on the microphone providing an accurate representation of the acoustic environment. For a deeper comparison between measurement and regular microphones, see our article: Differences Between Measurement Microphones and Regular Microphones. How Measurement Microphones Work The Condenser Principle How a condenser measurement microphone converts sound pressure into an electrical signal Nearly all measurement microphones are condenser (capacitor) microphones. The core transduction mechanism is simple but elegant: A thin metallic diaphragm is stretched in front of a rigid backplate, separated by a small air gap The diaphragm and backplate form a capacitor When sound pressure deflects the diaphragm, the gap changes, altering the capacitance With a constant charge on the capacitor, the capacitance change produces a proportional voltage change This voltage change is the microphone's output signal. A preamplifier, typically located immediately behind the capsule, converts the high-impedance signal from the capacitor into a low-impedance signal that can travel through cables to the data acquisition system. Polarization: External vs. Prepolarized Externally polarized (left) vs. prepolarized electret (right) microphone types The condenser principle requires a polarization voltage to maintain a charge on the capacitor. There are two approaches: Externally polarized microphones receive their polarization voltage (typically 200V) from an external power supply through the preamplifier. These microphones are considered the gold standard for the highest-accuracy laboratory measurements because: - The polarization voltage is stable and well-defined - No aging effects from the polarization source - Best long-term stability Prepolarized (electret) microphones use a permanently charged PTFE (Teflon) layer on the backplate to maintain polarization. Advantages include: - No external polarization supply needed — simplifies the signal chain - More resistant to humidity (no risk of charge leakage at high humidity) - Better suited for field measurements and harsh environments - Modern prepolarized microphones achieve accuracy comparable to externally polarized models Feature Externally Polarized Prepolarized Polarization source External 200V supply Built-in electret layer Best for Lab/reference measurements Field and industrial use Humidity tolerance Sensitive above ~90% RH Excellent, even in high humidity Long-term stability Excellent Very good (modern designs) Signal chain Requires compatible power supply Works with standard IEPE/ICP preamplifiers The Preamplifier The preamplifier is a critical but often overlooked component. It serves two functions: Impedance conversion: Transforms the microphone's extremely high output impedance (~GΩ) into a low impedance suitable for cable transmission Signal conditioning: Provides the power for IEPE/ICP operation or the polarization voltage for externally polarized capsules A matched microphone-preamplifier set ensures optimal performance. This is why measurement microphones are often sold as complete sets with a matched preamplifier — the combined system is calibrated and characterized as a unit. Types of Measurement Microphones Measurement microphones are classified along two primary axes: sound-field type and physical size. By Sound-Field Type The choice of microphone type depends on the acoustic environment where measurements will be taken. Free-Field Microphones A free-field microphone is designed to measure sound arriving from a single direction in an environment free of reflections (such as an anechoic chamber or outdoors). The microphone's frequency response is compensated for the acoustic diffraction effects caused by its own physical presence in the sound field. When to use: Outdoor measurements, anechoic chamber testing, source identification, environmental noise monitoring, any scenario where sound arrives predominantly from one direction. Orientation: Point the microphone directly at the sound source (0° incidence). Pressure-Field Microphones A pressure-field microphone measures the actual sound pressure at a surface or in a sealed cavity. It has the flattest possible response when the sound field is uniform across the diaphragm — which occurs in small cavities, couplers, or at surfaces where the microphone is flush-mounted. When to use: Coupler measurements (headphone and earphone testing), hearing aid testing, measurements in small cavities, flush-mounted surface measurements, acoustic impedance measurements. Orientation: The microphone diaphragm is placed at or within the measurement surface. Random-Incidence Microphones A random-incidence (diffuse-field) microphone is optimized for environments where sound arrives from all directions simultaneously — such as reverberant rooms. Its frequency response is a weighted average of responses at all angles of incidence. When to use: Reverberation chamber measurements, environmental noise in reflective spaces, any situation where sound arrives from multiple directions. Microphone Type Sound Field Typical Application Orientation Free-field Sound from one direction Outdoor noise, anechoic testing, source ID Point at source Pressure-field Uniform pressure (cavity) Coupler testing, headphones, hearing aids Flush with surface Random-incidence Sound from all directions Reverberant rooms, diffuse environments Any orientation Three microphone types for different acoustic environments: free-field, pressure-field, and random-incidence By Physical Size Measurement microphone capsules come in three standard sizes, each with distinct trade-offs: 1-Inch Microphones The largest standard size. High sensitivity and low noise floor make them ideal for measuring very quiet environments. Sensitivity: ~50 mV/Pa (highest) Frequency range: Up to ~8–16 kHz Best for: Low-frequency and low-level measurements, environmental noise monitoring, building acoustics Limitation: Large size limits upper frequency range due to diffraction effects 1/2-Inch Microphones The most widely used size. Offers a good balance between sensitivity, frequency range, and physical size. Sensitivity: ~12.5–50 mV/Pa Frequency range: Up to 20–40 kHz Best for: General-purpose acoustic measurements, NVH testing, product R&D, sound level meters Why it's popular: Versatile enough for most applications; fits standard sound level meter bodies 1/4-Inch Microphones The smallest standard size. Low sensitivity but the widest frequency range. Sensitivity: ~1.6–16 mV/Pa Frequency range: Up to 40–100 kHz Best for: High-frequency measurements, ultrasonic applications, small coupler measurements, acoustic array elements Trade-off: Higher noise floor requires louder sound sources for accurate measurement Size comparison: 1-inch (CRY3101), 1/2-inch (CRY3203), and 1/4-inch (CRY3401) measurement microphone capsules Size Sensitivity (typical) Frequency Range Dynamic Range Best For 1 inch 50 mV/Pa 4 Hz – 16 kHz 15–146 dBA Low-frequency, quiet environments 1/2 inch 12.5–50 mV/Pa 3 Hz – 40 kHz 16–164 dBA General-purpose, NVH, SLM 1/4 inch 1.6–16 mV/Pa 4 Hz – 100 kHz 32–174 dBA High-frequency, ultrasonic, arrays Key Specifications Explained When comparing measurement microphones, these specifications matter most: Sensitivity Sensitivity defines how much electrical output the microphone produces for a given sound pressure. Expressed in mV/Pa (millivolts per Pascal) or dB re 1V/Pa. Higher sensitivity = better signal-to-noise ratio at low sound levels Lower sensitivity = higher maximum SPL before distortion There is always a trade-off between sensitivity and maximum SPL Frequency Response The frequency range over which the microphone provides accurate measurements, typically specified within ±2 dB or ±1 dB. The useful range depends on: - Microphone size (smaller = wider range) - Sound-field type (free-field compensation extends the useful range) - Mounting configuration Dynamic Range The span between the lowest measurable level (noise floor) and the highest level before a specified distortion threshold (typically 3% THD). A wider dynamic range means the microphone can handle a greater variety of measurement scenarios. Self-Noise (Equivalent Noise Level) The inherent electrical noise of the microphone, expressed as an equivalent sound pressure level in dBA. Lower is better — critical for measuring quiet environments. 1-inch microphones: ~15–18 dBA (quietest) 1/2-inch microphones: ~16–28 dBA 1/4-inch microphones: ~32–46 dBA Stability and Temperature Coefficient Long-term sensitivity drift and sensitivity change with temperature. Important for: - Permanent monitoring installations (fixed outdoor microphones) - Measurements in extreme environments (engine test cells, climatic chambers) - Ensuring measurement results are comparable over months or years IEC Standards Compliance Measurement microphones are classified according to IEC 61094 series: - IEC 61094-1: Primary calibration by reciprocity method - IEC 61094-4: Specifications for working standard microphones (laboratory use) - IEC 61094-5: Working standard microphones for in-situ (field) use Sound level meters incorporating measurement microphones must comply with: - IEC 61672-1: Class 1 (precision) or Class 2 (general purpose) How to Choose the Right Measurement Microphone How to select the right measurement microphone for your application Step 1: Identify Your Sound Field Your Measurement Scenario Recommended Type Outdoor environmental noise Free-field Anechoic chamber testing Free-field Headphone/earphone coupler Pressure-field Hearing aid testing Pressure-field Reverberant room Random-incidence Surface-mounted on a machine Pressure-field General factory noise Free-field or random-incidence Step 2: Determine Required Frequency Range Application Minimum Frequency Range Building acoustics 20 Hz – 8 kHz Environmental noise 20 Hz – 12.5 kHz General acoustic testing 20 Hz – 20 kHz NVH (automotive) 20 Hz – 20 kHz Electroacoustic product testing 20 Hz – 40 kHz Ultrasonic measurements 20 Hz – 100 kHz Step 3: Match the Dynamic Range to Your Environment Quiet environments (recording studios, anechoic chambers): Choose high-sensitivity microphones (50 mV/Pa, 1/2" or 1") with low self-noise Industrial environments (factory floors, engine test cells): Choose lower-sensitivity microphones (4–12.5 mV/Pa, 1/4" or 1/2") with high maximum SPL Wide-range applications: Choose microphones with the widest dynamic range available Step 4: Consider Environmental Conditions High humidity or outdoor use: Prepolarized microphones are recommended Extreme temperatures: Check the microphone's operating temperature range and temperature coefficient Dusty or wet environments: Look for IP-rated solutions (e.g., IP67 for NVH field testing) Hazardous areas: Check for ATEX/IECEx certification if required Step 5: Evaluate the Complete System A measurement microphone does not work alone. Consider: - Preamplifier compatibility: Matched sets ensure specified performance - Data acquisition system: Input impedance, voltage range, and sampling rate must match - Calibration infrastructure: Do you have access to a pistonphone or acoustic calibrator? - Software ecosystem: Can your analysis software import calibration data and apply corrections? Applications Electroacoustic Product Testing Testing loudspeakers, headphones, earphones, and hearing aids requires microphones that can accurately capture the device's frequency response, distortion, and directivity. Pressure-field microphones are used in couplers (IEC 60318 ear simulators), while free-field microphones are used in anechoic chambers. Automotive and Aerospace NVH NVH (Noise, Vibration, and Harshness) engineers use measurement microphones to characterize cabin noise, identify noise sources, evaluate sound packages, and perform transfer path analysis. Requirements include wide frequency range, high dynamic range, and robustness for field use. Environmental and Community Noise Monitoring Long-term outdoor noise monitoring stations require microphones with excellent stability over months or years, low temperature sensitivity, and tolerance to humidity, rain, and wind. Windscreens and weather protection accessories are essential. Production Line Quality Control In manufacturing, measurement microphones integrated into automated test systems verify that every loudspeaker, headphone, or microphone meets specifications before shipping. Speed, repeatability, and consistency are critical — the microphone must produce identical results across thousands of units per day. Building and Architectural Acoustics Measuring reverberation time, sound insulation, and HVAC noise requires accurate low-frequency performance and the ability to work in diffuse sound fields. Random-incidence microphones are often preferred. Acoustic Research and Standards Laboratories Primary and secondary calibration laboratories, standards organizations, and university research groups require the highest-accuracy microphones — typically externally polarized, laboratory-grade capsules calibrated by reciprocity methods. Sound Source Localization and Beamforming Microphone arrays used in acoustic cameras and beamforming systems require large numbers of measurement microphones with tightly matched sensitivity and phase response. 1/4-inch microphones are preferred for arrays due to their small size and wide frequency range. For more on acoustic imaging technology, see our guide on acoustic cameras. Noise Regulation Compliance Regulatory compliance measurements — workplace noise (ISO 9612), environmental noise (ISO 1996), product noise emission (ISO 3744/3745) — require Class 1 or Class 2 measurement microphones as specified in IEC 61672. Documentation of calibration traceability is mandatory for compliance reporting. CRYSOUND Measurement Microphone Solutions CRYSOUND's CRY3000 series measurement microphones cover the full range of sizes, field types, and applications — from laboratory reference measurements to rugged field testing. Complete Size Coverage: 1/4", 1/2", and 1" Model Size Field Type Sensitivity Frequency Range Application CRY3101-S01 1" Free-field 50 mV/Pa 4 Hz – 16 kHz Low-frequency, quiet environments CRY3203-S01 1/2" Free-field 50 mV/Pa 3.15 Hz – 20 kHz General acoustic testing CRY3261-S02 1/2" Free-field 450 mV/Pa 10 Hz – 16 kHz Ultra-high sensitivity CRY3201-S01 1/2" Free-field 12.5 mV/Pa 3.15 Hz – 40 kHz Extended high-frequency CRY3401-S01 1/4" Free-field 15.8 mV/Pa 4 Hz – 40 kHz High-frequency testing CRY3403-S01 1/4" Free-field 4 mV/Pa 4 Hz – 90 kHz Ultrasonic measurements CRY3202-S01 1/2" Pressure 12.5 mV/Pa 3.15 Hz – 20 kHz Coupler and cavity testing CRY3402 1/4" Pressure 1.6 mV/Pa 4 Hz – 100 kHz High-frequency pressure field CRY3406-S01 1/4" Pressure 15.8 mV/Pa 4 Hz – 40 kHz Low-noise pressure field CRY3213: Purpose-Built for NVH The CRY3213 NVH Measurement Microphone is specifically designed for the demanding conditions of automotive and industrial NVH testing: IP67 protection: Fully dust-tight and submersible — operates reliably in engine bays, test tracks, and climatic chambers Extended temperature range: -50°C to 125°C, covering extreme hot and cold testing scenarios Free-field response: 3.15 Hz to 20 kHz, optimized for the frequency range relevant to cabin noise, powertrain NVH, and road noise 50 mV/Pa sensitivity: High enough for quiet cabin measurements, robust enough for engine noise Matched Microphone-Preamplifier Sets Every CRYSOUND measurement microphone set includes a matched preamplifier, factory-calibrated as a complete system. This eliminates the guesswork of mixing microphones and preamplifiers from different sources, and ensures that the combined frequency response, noise floor, and dynamic range meet the published specifications. Calibration and Traceability All CRYSOUND measurement microphones ship with individual calibration certificates traceable to national standards. For ongoing measurement assurance, see our guide on measurement microphone calibration. Explore CRYSOUND Measurement Microphones → Frequently Asked Questions What is the difference between a measurement microphone and a regular microphone? A measurement microphone is designed for accuracy and traceability — its output must truthfully represent the sound pressure at the measurement point. A regular microphone is designed for audio quality, often with intentional frequency shaping to enhance speech clarity or musical timbre. For a detailed comparison, read Measurement vs. Regular Microphones. Do I need to calibrate my measurement microphone? Yes. Regular calibration — at minimum before each measurement session using an acoustic calibrator — ensures your results are accurate and traceable. Periodic laboratory recalibration (typically annually) verifies long-term stability. Learn more about microphone calibration. Can I use a 1/2-inch microphone for ultrasonic measurements? Standard 1/2-inch microphones typically reach up to 20–40 kHz, which is insufficient for many ultrasonic applications. For measurements above 40 kHz, a 1/4-inch microphone is recommended — models like the CRY3403 reach 90 kHz, while the CRY3402 reaches 100 kHz. What does "free-field" vs. "pressure-field" mean? A free-field microphone is optimized for measuring sound arriving from one direction in open space. A pressure-field microphone is optimized for measuring sound pressure in enclosed cavities or at surfaces. The difference is in how the microphone compensates for acoustic diffraction effects at high frequencies. How do I choose between externally polarized and prepolarized? For laboratory reference measurements in controlled environments, externally polarized microphones offer the best long-term stability. For field measurements, industrial applications, or environments with high humidity, prepolarized microphones are more practical and equally accurate with modern designs. What IP rating do I need for outdoor or industrial use? For NVH field testing and outdoor measurements, IP67 (dust-tight, waterproof) provides the best protection. The CRY3213 is specifically designed for these conditions. For general lab use, IP protection is typically not required. Need help selecting the right measurement microphone for your application? Contact CRYSOUND for expert guidance based on your specific measurement requirements.
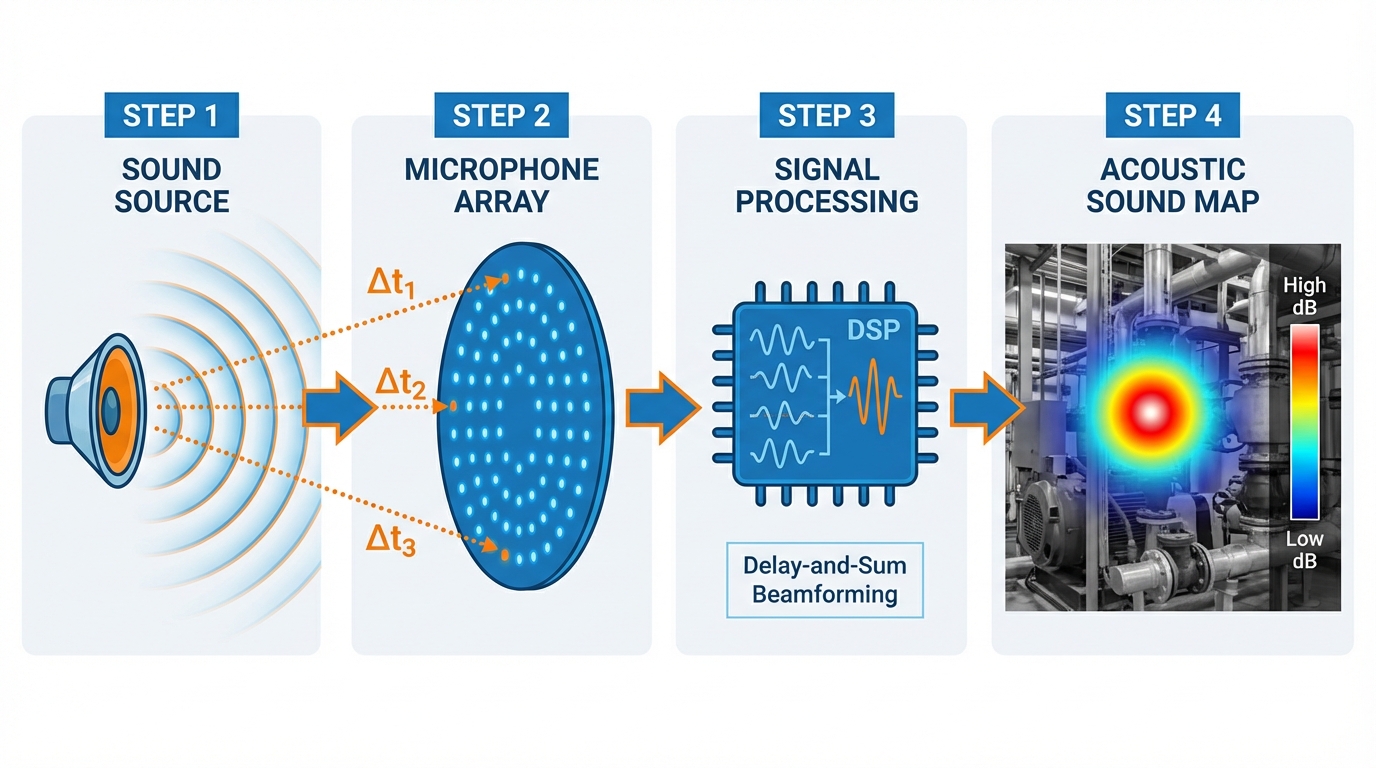
Acoustic cameras turn invisible sound into visible images. This guide explains how they work, where they're used, and how to choose the right one for your application. What Is an Acoustic Camera? An acoustic camera is a device that locates and visualizes sound sources in real time. It combines a microphone array — typically 64 to 200+ MEMS microphones arranged in a specific pattern — with a video camera and signal processing software. The result is a color-coded overlay on a live video feed, showing exactly where sound is coming from and how loud it is. Think of it as a thermal camera, but for sound instead of heat. Where a thermal camera shows hot spots in red, an acoustic camera shows loud spots — pinpointing the exact location of a leak, a faulty bearing, or an electrical discharge that you can't see with your eyes. The technology was originally developed for aerospace and automotive NVH (Noise, Vibration, and Harshness) testing. Today, it has expanded into industrial maintenance, energy utilities, manufacturing quality control, and building acoustics. How Does an Acoustic Camera Work? How an acoustic camera uses beamforming: sound waves arrive at each microphone with different time delays (Δt), the processor combines all signals, and outputs a color-coded sound map. The Microphone Array At the core of every acoustic camera is a microphone array — a precisely arranged set of MEMS (Micro-Electro-Mechanical Systems) microphones. The number of microphones directly affects performance: 64 microphones: Entry-level, suitable for general-purpose sound source localization 128 microphones: Professional-grade, better resolution and dynamic range 200+ microphones: High-end, capable of detecting subtle sources in noisy environments The spatial arrangement of these microphones matters as much as the count. Common configurations include circular, spiral (Fibonacci), and grid patterns. Each has trade-offs: spiral arrays offer good broadband performance, while grid arrays are better for near-field measurements. Beamforming: The Core Algorithm The key technology behind acoustic cameras is beamforming — a signal processing technique that combines signals from multiple microphones to "focus" on specific locations in space. Here's a simplified explanation: A sound wave arrives at each microphone at slightly different times (because each microphone is at a different distance from the source) The software calculates the expected time delay for every possible source location in the field of view For each candidate location, it shifts and sums the microphone signals according to the calculated delays Locations where the shifted signals add up constructively are identified as sound sources This process is repeated for every pixel in the image, producing a "sound map" that shows the spatial distribution of sound energy. Beamforming vs. Acoustic Holography There are two main acoustic imaging technologies: FeatureBeamformingAcoustic Holography (NAH)Best frequency rangeMid to high frequencies (>500 Hz)Low frequencies (<2 kHz)Measurement distanceFar-field (>1 meter)Near-field (<30 cm from source)ResolutionLimited by wavelength and array sizeHigher resolution at low frequenciesSpeedReal-time capableRequires careful scanningBest forLeak detection, general noise mappingEngine NVH, vibration analysis Most modern acoustic cameras use beamforming as the primary method because it works in real time and doesn't require the camera to be positioned close to the source. Some advanced systems support both technologies for maximum flexibility. The Role of the Video Camera The microphone array generates a sound map; the video camera provides the visual reference. The software overlays the sound map onto the video feed as a color-coded heat map, allowing the user to instantly see which component, pipe, or connection is producing the sound. High-end systems use depth cameras (such as Intel RealSense) to create 3D acoustic maps, enabling more accurate source localization on complex geometry. Frequency Range: Why It Matters Different applications require different frequency ranges: ApplicationTypical Frequency RangeWhyCompressed air leak detection20–50 kHzLeaks produce high-frequency hissingPartial discharge detection20–100 kHzElectrical discharges emit ultrasonic signalsMechanical fault detection1–20 kHzBearing wear, misalignment produce audible noiseAutomotive NVH100 Hz–10 kHzRoad noise, wind noise, engine noiseBuilding acoustics50 Hz–8 kHzLow-frequency structure-borne noise An acoustic camera with a frequency range of up to 100 kHz can handle virtually all industrial applications, including ultrasonic leak and partial discharge detection. Cameras limited to 20 kHz are suitable only for audible noise analysis. Key Applications Acoustic camera detecting vacuum leaks in composite materials — the color overlay pinpoints the exact leak location on the surface. Partial discharge detection on high-voltage insulators — the acoustic camera identifies discharge locations from a safe distance, combined with infrared thermal imaging for comprehensive diagnostics. 1. Compressed Air Leak Detection Compressed air is one of the most expensive energy sources in a factory. Studies show that 20–30% of compressed air is lost to leaks. An acoustic camera can scan an entire production line in minutes, identifying leaks that are invisible and inaudible to human ears. Why acoustic cameras beat traditional methods: Ultrasonic leak detectors require you to check one point at a time; an acoustic camera scans an entire area at once Visual overlay pinpoints the exact location — no guessing Many systems can estimate leak rate and annual cost, helping you prioritize repairs 2. Electrical Partial Discharge Detection Partial discharge (PD) is an early warning sign of insulation failure in high-voltage equipment — transformers, switchgear, cables, and bus bars. Left undetected, PD leads to complete insulation breakdown and potentially catastrophic failure. Acoustic cameras detect PD by capturing the ultrasonic emissions (typically 20–100 kHz) that accompany electrical discharge. The advantage over traditional PD detection methods: Non-contact: No need to de-energize equipment Real-time visualization: See exactly where the discharge is occurring Safe distance: Inspect live equipment from several meters away 3. Mechanical Fault Diagnosis Worn bearings, misaligned shafts, loose components, and valve leaks all produce characteristic sound signatures. An acoustic camera can identify and locate these faults before they lead to unplanned downtime. Common use cases: Motor and pump bearing wear detection Steam trap malfunction Valve leak identification Gearbox noise analysis 4. Automotive and Aerospace NVH Testing This is where acoustic cameras originated. NVH engineers use them to: Identify wind noise sources on vehicle bodies Locate rattles and squeaks in interior trim Analyze tire/road noise contributions Map engine noise radiation patterns Validate sound package effectiveness For NVH applications, large-aperture arrays (200+ microphones) provide the resolution needed to distinguish closely spaced sources. 5. Noise Compliance and Building Acoustics Environmental noise regulations require manufacturers to identify and reduce noise emissions. Acoustic cameras help: Map factory noise sources for compliance reporting Identify noise paths in buildings (walls, windows, HVAC) Verify effectiveness of noise barriers and enclosures 6. UAV-Mounted Acoustic Inspection A newer application: mounting acoustic cameras on drones for inspection of hard-to-reach infrastructure. Applications include: Power line and substation inspection Wind turbine blade inspection Pipeline corridor leak surveys Tall structure noise mapping Types of Acoustic Cameras Four form factors of acoustic cameras: Handheld (CRY8124), Fixed-Mount (CRY2623M), Large Array (CRY8500 SonoCAM Pi), and UAV-Mounted (CRY2626G). Handheld Acoustic Cameras Portable, battery-powered devices for field use. Typically 64–128 microphones with a built-in display. Best for maintenance rounds, leak detection, and quick inspections. Pros: Portable, easy to use, quick deployment Cons: Limited microphone count, smaller array = lower resolution at distance Fixed/Mounted Acoustic Cameras Permanently installed for continuous monitoring. Used in power substations, data centers, and critical infrastructure. Can run 24/7 with automated alerts. Pros: Continuous monitoring, automated alerting, no operator needed Cons: Fixed field of view, higher installation cost Large-Array Systems 200+ microphones on a larger frame. Used for NVH testing, pass-by noise measurement, and research applications. Often mounted on tripods or overhead structures. Pros: Highest resolution, widest frequency range, best for complex analysis Cons: Not portable, requires setup, higher cost UAV-Mounted Systems Lightweight acoustic arrays designed for drone mounting. Used for remote inspection of power lines, pipelines, and industrial facilities. Pros: Access to hard-to-reach locations, large-area surveys Cons: Flight time limits, vibration interference, regulatory requirements How to Choose the Right Acoustic Camera Quick decision guide: Choose your acoustic camera based on primary application. Step 1: Define Your Primary Application Your application determines the minimum specifications: ApplicationMin. MicrophonesFrequency RangeForm FactorCompressed air leak detection64Up to 50 kHzHandheldPartial discharge detection64–128Up to 100 kHzHandheld or fixedMechanical fault diagnosis64Up to 20 kHzHandheldNVH testing128–200+100 Hz–20 kHzLarge arrayContinuous monitoring64–128Application-dependentFixedDrone inspection64–128Up to 50 kHzUAV-mounted Step 2: Consider the Environment Noisy factory floor? You need more microphones and advanced algorithms to separate the target signal from background noise Outdoor use? Look for weather-resistant designs and wind noise rejection Hazardous area? Check for ATEX/IECEx certification Large distance? More microphones = better resolution at range Step 3: Evaluate the Software The hardware captures the data; the software turns it into actionable information. Key software features to look for: Real-time display: See the sound map live as you scan Frequency filtering: Isolate specific frequency bands to focus on particular issues Leak rate estimation: Quantify the cost of leaks in dollars or energy units Reporting: Generate professional reports with screenshots, measurements, and recommendations AI-assisted detection: Automatic identification of leak patterns and fault signatures Step 4: Compare Specifications Key specs to compare across manufacturers: SpecificationWhat It MeansWhat to Look ForMicrophone countMore mics = better resolution and sensitivity64 minimum; 128+ for demanding applicationsFrequency rangeDetermines what you can detectUp to 100 kHz for PD and ultrasonic leaksDynamic rangeAbility to measure both quiet and loud sources>70 dB for industrial environmentsAngular resolutionAbility to separate nearby sourcesSmaller is better; depends on frequency and distanceFrame rateHow quickly the sound map updates>10 fps for real-time scanningWeight and sizePortability<2 kg for handheld daily-use devicesBattery lifeRuntime for field use>3 hours for a full shift of inspectionsIP ratingDust and water resistanceIP54 or higher for industrial environments CRYSOUND Acoustic Camera Solutions CRYSOUND offers one of the widest product lines in the acoustic camera market — covering handheld, fixed-mount, large-array, and UAV-mounted form factors from a single manufacturer. Product Lineup CRY2624: 128-microphone handheld acoustic camera with ATEX certification — portable, field-ready, and safe for hazardous environments CRY8124: 200 MEMS microphones, frequency range up to 100 kHz — handles both audible noise analysis and ultrasonic applications (leak detection + partial discharge) in a single device CRY2623M: Fixed-mount version for 24/7 continuous monitoring of substations and critical infrastructure CRY8500 Series (SonoCAM Pi): Large spiral microphone array for NVH testing, pass-by noise measurement, and advanced acoustic research CRY2626G: Drone-mounted acoustic camera for remote inspection of power lines, pipelines, and wind turbines CRYSOUND acoustic camera product family: from handheld to drone-mounted solutions. Key Differentiator 1: Modular Sensor Expansion Unlike most competitors that offer a fixed-function device, CRYSOUND's acoustic cameras support external sensor modules for expanded capabilities: Infrared thermal imaging module: Combines acoustic and thermal data in a single view — when inspecting power equipment, engineers can simultaneously see the acoustic signature of partial discharge and the thermal hot spot of overheating components. This dual-mode inspection is widely used in power utilities for comprehensive substation diagnostics. IA3104 Contact Ultrasound Sensor: An external contact-type ultrasonic probe designed specifically for valve internal leak detection. The sensor couples directly to the metal surface of a valve, capturing high-frequency ultrasonic signals generated by internal leakage. Combined with intelligent analytics and guided workflows, it automates the full diagnostic process — from data acquisition to leak classification. This is critical for preventive maintenance of oil pipeline valves and natural gas network valves. This modular approach means a single CRYSOUND acoustic camera can serve as a comprehensive inspection platform, rather than requiring separate instruments for each detection task. Key Differentiator 2: Acoustic Link Mobile App CRYSOUND's Acoustic Link is a companion mobile app that connects to the acoustic camera via Wi-Fi. It enables: On-device preview: View captured photos, videos, and inspection reports on your phone or tablet — no PC required Defect-specific visualization: Retrieve gas-leak acoustic maps, partial-discharge patterns, and thermal images directly in the app One-tap sharing: Save results locally and share via the system share sheet for instant communication with colleagues and customers Automated report generation: Generate and export professional inspection reports from the field, eliminating the need to return to the office for post-processing For field inspection teams, this means faster turnaround from detection to documentation. Key Differentiator 3: Complete Acoustic Ecosystem Beyond acoustic cameras, CRYSOUND manufactures electroacoustic test systems (CRY6151B), acoustic test chambers, and calibration equipment — enabling complete acoustic testing solutions from a single vendor. With 28 years of experience and over 10,000 customers across 90+ countries, CRYSOUND brings deep domain expertise to every product. Explore CRYSOUND Acoustic Camera Products → Frequently Asked Questions What is the difference between an acoustic camera and a sound level meter? A sound level meter measures the overall sound pressure level at a single point. It tells you how loud it is, but not where the sound comes from. An acoustic camera shows both the location and the intensity of sound sources, making it far more useful for diagnosing and fixing noise problems. How far away can an acoustic camera detect a leak? Detection range depends on the leak size, background noise, microphone count, and frequency range. A typical handheld acoustic camera with 64–128 microphones can detect a 1mm compressed air leak from 10–30 meters away. Larger leaks can be detected from even greater distances. Can an acoustic camera work in a noisy factory? Yes. Modern acoustic cameras use beamforming algorithms that can isolate specific sound sources even in high-background-noise environments. The key is having enough microphones — more microphones provide better noise rejection and higher signal-to-noise ratio. Do I need training to use an acoustic camera? Basic operation is straightforward — point the camera, look at the screen, and identify the highlighted areas. Most users can start finding leaks within minutes. However, interpreting complex acoustic patterns (NVH analysis, partial discharge classification) benefits from training and experience. What is the ROI of an acoustic camera? For compressed air leak detection alone, the ROI is typically measured in months. A single quarter-inch air leak costs $2,500–$8,000 per year. Most industrial facilities have dozens to hundreds of leaks. An acoustic camera that helps you find and fix these leaks can pay for itself in the first survey. Can acoustic cameras detect gas leaks other than compressed air? Yes. Acoustic cameras can detect any pressurized gas leak that produces turbulent flow noise — including nitrogen, oxygen, hydrogen, natural gas, and refrigerants. The frequency characteristics may vary by gas type, but the detection principle is the same. Need help choosing the right acoustic camera for your application? Contact CRYSOUND for a personalized recommendation based on your specific requirements.

Automotive NVH (Noise, Vibration, and Harshness) testing is one of the most data-intensive disciplines in vehicle development. Getting it right requires a data acquisition system that can handle dozens of synchronised channels, maintain sub-microsecond timing accuracy across a moving vehicle, and feed results directly into analysis software — all without losing a single sample on a rough road. This guide explains what automotive NVH data acquisition actually involves, which specifications matter most, and how to evaluate whether a DAQ system is genuinely fit for purpose. What Does NVH Data Acquisition Actually Measure? NVH testing is not a single measurement — it is a coordinated capture of multiple physical quantities across time and space. A typical NVH acquisition session involves: 🎤 Sound pressure levels (SPL) — microphones at driver and passenger ear positions, outside the vehicle, and near specific components such as the engine bay or wheel arch 📳 Vibration and acceleration — IEPE accelerometers on the body structure, floor pan, steering column, seat rails, and powertrain mounts 🔄 Order tracking — tachometer or CAN-bus RPM signals combined with vibration channels to isolate engine, transmission, and driveline orders 🏗️ Structural response — transfer path analysis (TPA) requires simultaneous force and response measurements across multiple paths 🛣️ Road load data — strain gauges, wheel force transducers, and inertial measurement units (IMUs) captured over durability routes Capturing all of these simultaneously — in a moving vehicle, over variable terrain — is where the engineering challenge lies. Why Synchronisation Is the Critical Specification In NVH analysis, timing errors between channels corrupt every downstream calculation. Phase relationships between vibration sources and the acoustic response determine which path is dominant. An inter-channel delay of even a few microseconds introduces phase error that makes transfer path analysis unreliable at frequencies above a few hundred hertz. For road testing with GPS position logging, the timestamp alignment between the DAQ channels and the GPS receiver determines spatial resolution. At 100 km/h, a 1 ms timing error places a measurement event 2.8 cm away from its true location on the road. This is why precision synchronisation — either through a hardware clock distribution network or IEEE 1588 Precision Time Protocol (PTP) — is a non-negotiable requirement for serious NVH work, not a premium option. Key Specifications for an Automotive NVH DAQ System SpecificationWhy It Matters for NVHMinimum Requirement Channel countFull-vehicle modal surveys need 50–200+ channels simultaneously16+ per unit, scalable Synchronisation accuracyInter-channel phase error affects TPA validity above ~500 Hz<1 µs between channels Dynamic rangeMust capture both structural creaks (<1 mg) and road impacts (>100g) in the same session120 dB minimum; 160+ dB preferred IEPE compatibilityStandard interface for accelerometers and condenser microphonesAll channels Channel isolationPrevents ground loops from corrupting data in electrically noisy vehicle environments; essential for EV high-voltage environments≥500 V; 1000 V for EV testing Sampling rateAnti-aliasing filter sets usable bandwidth; NVH typically needs DC–20 kHz51.2 kS/s per channel minimum GPS integrationSpatial correlation of NVH events to road surfaceNMEA or PPS-based timestamp Common NVH Testing Scenarios and Their DAQ Requirements 🏎️ Road NVH and Pass-by Noise Road testing requires a self-contained system that operates without a tethered PC. Battery power, GPS timestamp synchronisation, and ruggedised connectors are essential. The system must log continuously at full bandwidth across all channels without dropping samples when the vehicle hits rough patches. ⚙️ Powertrain and Driveline NVH Engine and transmission testing demands tachometer-synchronised order tracking. Channels need to handle the temperature range of an engine bay, and the system should support CAN or OBD-II integration to log vehicle operating parameters alongside the acoustic and vibration data. ⚡ EV and Hybrid Powertrain Testing Electric vehicles remove combustion masking noise, exposing gear whine, inverter switching harmonics, and electric motor tonalities that were previously buried. EV testing also introduces the safety requirement for galvanic isolation between measurement channels and the vehicle's high-voltage system — typically 1000 V or higher. 🏗️ Transfer Path Analysis (TPA) TPA requires simultaneous measurement of forces at source attachment points and acoustic/vibration responses at target locations. This is channel-count-intensive and phase-critical — errors in synchronisation produce incorrect path rankings, leading teams to treat the wrong component. 🎯 Evaluating DAQ systems for your project? SonoDAQ Pro combines 170 dB dynamic range, 1000 V isolation, and ≤100 ns PTP sync in a modular platform built for real test environments. View SonoDAQ Pro → Request a Demo SonoDAQ Pro for Automotive NVH Data Acquisition SonoDAQ Pro is a modular acoustic and vibration DAQ system designed to address the requirements above without the complexity and cost of traditional high-channel-count platforms. 📊 4 to 24 channels per unit, expandable across multiple synchronised units for large-scale surveys ⏱️ PTP (IEEE 1588) and GPS synchronisation with ≤100 ns inter-channel delay — sufficient for TPA work through the full NVH frequency range 🔋 170 dB dynamic range — captures both low-level structural resonances and high-amplitude road shock inputs in a single acquisition ⚡ 1000 V per-channel isolation — safe for use alongside EV high-voltage systems without additional isolation amplifiers 💻 Integrated with OpenTest — open-source analysis platform covering order tracking, octave-band analysis, sound quality metrics, and automated reporting without per-seat licence fees SonoDAQ Pro supports both laboratory bench testing and field road measurements in a single hardware platform, reducing the need to maintain separate systems for different test environments. Frequently Asked Questions How many channels do I need for a full-vehicle NVH test? A minimal interior NVH survey (two ear-position microphones, four structural accelerometers, one tachometer) needs 7 channels. A comprehensive full-body modal survey for body-in-white characterisation typically uses 64–256 response channels. Most production vehicle NVH refinement programmes operate in the 16–64 channel range, expanding as the investigation narrows to specific subsystems. What is the difference between IEPE and charge-mode accelerometers for NVH? IEPE (Integrated Electronics Piezo-Electric) accelerometers have a built-in amplifier powered by a constant current from the DAQ front end. They are simpler to connect, less sensitive to cable capacitance, and the standard choice for most NVH work. Charge-mode sensors require an external charge amplifier and are preferred for very high-temperature environments (above ~120°C) where the built-in electronics would be damaged. For typical vehicle NVH measurement locations, IEPE is the practical choice. Does PTP synchronisation work reliably in a vehicle with multiple units? PTP (IEEE 1588) synchronisation operates over standard Ethernet and achieves sub-microsecond accuracy in a point-to-point or simple switched network. In a vehicle environment, the main requirement is a dedicated Ethernet connection between units — not shared with infotainment or other vehicle network traffic. With a dedicated switch and proper network configuration, PTP reliably maintains ≤100 ns synchronisation accuracy between units, which is more than sufficient for NVH analysis up to 20 kHz. Can the same DAQ system be used for both lab and road testing? Yes, provided the system supports both AC-powered laboratory operation and battery or vehicle-powered field operation, and that it is ruggedised for the vibration and temperature range encountered in road testing. The advantage of a single platform across environments is consistent calibration and data formats — results from road tests and anechoic chamber measurements can be directly compared without format conversion. → Learn more about SonoDAQ Pro | Request a demo for your NVH application
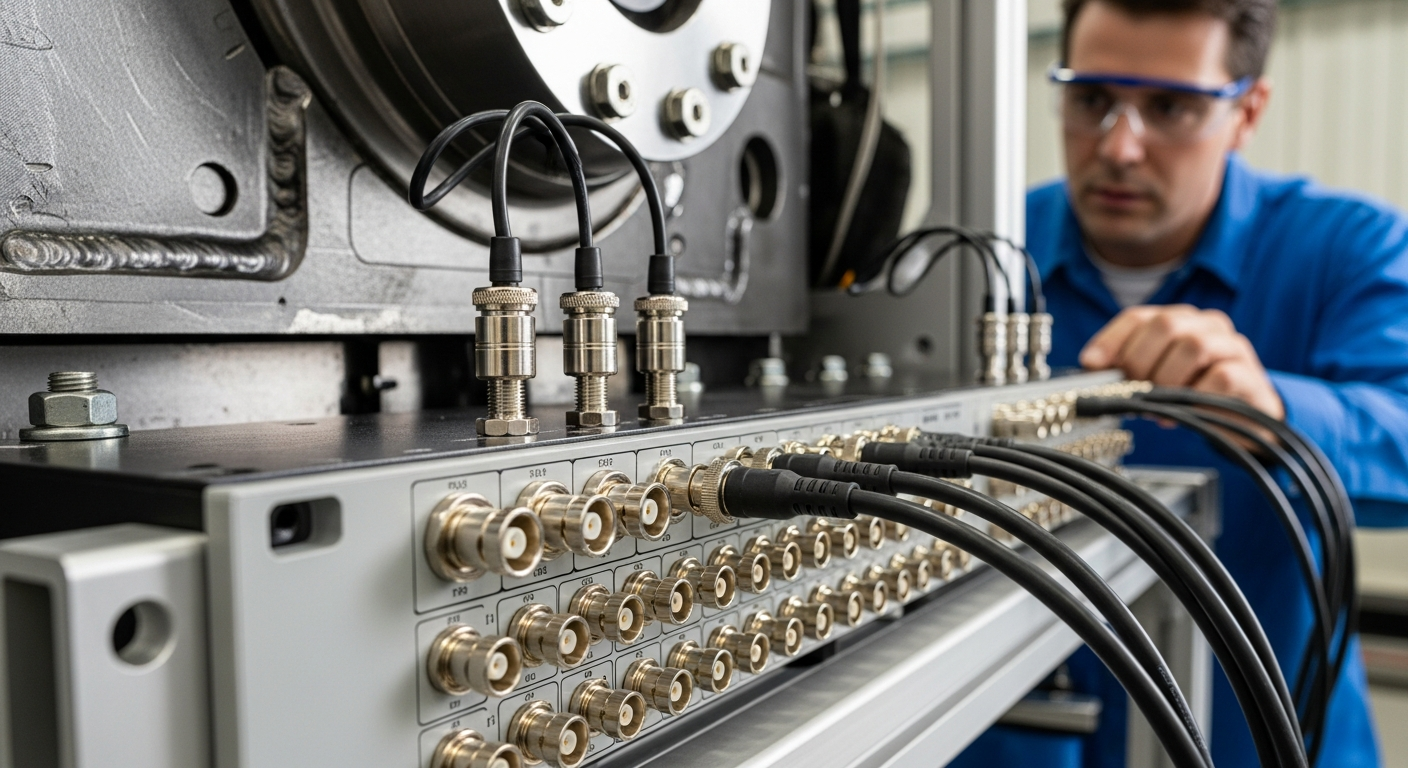
Vibration tells you what a single accelerometer cannot: how energy moves through a structure, where it originates, how it couples between components, and which path dominates the response at a given frequency. Capturing that information requires multiple channels measured simultaneously — not sequentially — with timing tight enough that phase relationships are preserved. This guide covers the architecture of a multi-channel vibration measurement system, the specifications that determine real-world performance, how to scale channel count for different applications, and what to look for when choosing a platform. Why Multi-Channel Matters: What Single-Channel Measurements Miss A single accelerometer tells you the vibration amplitude and frequency content at one point. What it cannot tell you is whether that vibration is coming from a bearing 40 cm away, resonating through a bracket, or being driven by a rotating imbalance three structural paths upstream. Multi-channel simultaneous measurement enables: 🔗 Phase analysis — determining the direction of wave propagation and identifying mode shapes 📐 Modal analysis — extracting natural frequencies, damping ratios, and mode shapes by measuring the structure's response across spatial points simultaneously 🛣️ Transfer path analysis (TPA) — quantifying how much each source-path combination contributes to the target response 📊 Coherence and cross-spectrum analysis — identifying which vibration sources are correlated, and by how much ⚡ Operational deflection shapes (ODS) — visualising how a structure actually deforms under real operating loads None of these analyses are possible — or valid — with multiplexed single-channel capture or with channels measured in separate passes. System Architecture: From Sensor to Result 🎯 Sensors — IEPE accelerometers are the standard choice for most vibration work, providing a low-impedance voltage output directly compatible with DAQ front ends. Charge-mode sensors are used in high-temperature environments. Force transducers, laser vibrometers, and strain gauges may be added for specific measurements. ⚙️ Signal conditioning — Each channel requires IEPE current excitation, high-pass filtering to remove DC offset, and anti-aliasing low-pass filtering matched to the sampling rate. The conditioning stage also determines the input voltage range and dynamic range. 🔢 Analogue-to-digital conversion (ADC) — Simultaneous-sample ADCs are required for phase-critical measurements. Delta-sigma ADCs provide excellent dynamic range but require careful attention to anti-aliasing filter group delay when comparing channels at different sample rates. 💻 Software and analysis — The acquisition software must handle synchronised multi-channel data streams, provide real-time monitoring, and export to analysis tools. Integration with FFT, order tracking, modal analysis, and reporting workflows determines how quickly results reach the engineer. Key Specifications Explained SpecificationWhat It ControlsPractical Implication Dynamic range (dB)Ratio of maximum to minimum measurable signalHigher dynamic range captures both low-level resonances and high-amplitude shocks in a single acquisition without range switching Sampling rate (kS/s per channel)Maximum measurable frequency (Nyquist limit)51.2 kS/s gives usable bandwidth to ~20 kHz; higher rates needed for ultrasonic or structural impact measurements Anti-aliasing filterPrevents out-of-band signals from folding into the measurement bandDigital AA filters in delta-sigma ADCs introduce group delay; hardware AA filters add cost but simplify cross-channel phase comparison Synchronisation accuracy (ns)Inter-channel timing alignmentPhase error = 2π × frequency × timing error; 100 ns error = 0.036° at 1 kHz, 0.36° at 10 kHz — acceptable for most NVH work Channel isolation (V)Electrical separation between channels and from chassis groundPrevents ground loops in multi-point setups; essential for safety in high-voltage environments (EV testing, industrial machinery) IEPE excitation current (mA)Powers IEPE sensorsMost IEPE sensors require 2–20 mA; check sensor datasheet against DAQ excitation specification Input range (V peak)Maximum signal before clippingMust accommodate the highest expected signal; combined with dynamic range, determines minimum detectable signal Applications by Industry 🚗 Automotive NVH Vehicle development relies on multi-channel vibration measurement for body-in-white modal surveys, powertrain NVH characterisation, road load data acquisition, and transfer path analysis. Channel counts range from 16 for targeted subsystem studies to 200+ for full-vehicle modal tests. GPS synchronisation is required for road measurements. ✈️ Aerospace and Structural Testing Aircraft structural certification and flutter testing require simultaneous measurement at hundreds of points during ground vibration tests (GVTs). Airborne measurements add the requirement for lightweight, power-efficient hardware. Synchronisation between fuselage, wing, and empennage measurement points must be maintained over long cable runs. 🏭 Industrial Machinery and Condition Monitoring Rotating machinery diagnostics (bearings, gears, imbalance, misalignment) use vibration signatures to detect developing faults before failure. Multi-channel systems allow simultaneous monitoring of multiple machines or measurement at multiple axial/radial positions on a single machine. Continuous long-term monitoring requires high system stability and automated alarming. 📱 Consumer Electronics and Haptics Speaker, motor, and actuator characterisation in smartphones, wearables, and home appliances requires vibration measurement alongside acoustic output. Multi-channel DAQ systems correlate structural vibration with acoustic radiation to identify resonances that degrade sound quality or generate tactile artefacts. Scaling from 4 to 100+ Channels 📦 Module-based expansion — add acquisition modules to increase channel count; each module shares the same clock and synchronisation infrastructure 🌐 Network synchronisation — PTP (IEEE 1588) over Ethernet allows multiple independent units to operate as a single synchronised system, enabling distributed measurement across a large structure without running long analogue cables 🔌 Mixed signal types — modular systems allow different input types (IEPE, voltage, microphone, tacho, CAN) within the same synchronised acquisition session 🎯 Evaluating DAQ systems for your project? SonoDAQ Pro combines 170 dB dynamic range, 1000 V isolation, and ≤100 ns PTP sync in a modular platform built for real test environments. View SonoDAQ Pro → Request a Demo SonoDAQ Pro: Multi-Channel Vibration Measurement Built for Real Test Environments SonoDAQ Pro is a modular multi-channel DAQ system designed for acoustic and vibration applications where synchronisation accuracy, dynamic range, and channel isolation are engineering requirements rather than marketing specifications. 📊 4–24 channels per unit, scalable across units via PTP network synchronisation 🎯 170 dB dynamic range — captures structural creaks and road shocks in the same acquisition without range switching ⏱️ ≤100 ns inter-channel synchronisation via IEEE 1588 PTP or GPS — phase-accurate through 20 kHz across all channels and all units ⚡ 1000 V per-channel isolation — prevents ground loops in multi-point setups and provides safety margin for EV and industrial high-voltage environments 💻 Integrated with OpenTest — open-source analysis platform supporting FFT, order tracking, octave-band analysis, sound quality metrics, and automated Python-based post-processing workflows Frequently Asked Questions What sampling rate do I need for vibration measurement? The required sampling rate depends on the highest frequency of interest. Shannon's theorem requires a sampling rate at least twice the highest signal frequency; practical systems use 2.5× or more to allow for anti-aliasing filter roll-off. For NVH work covering 0–20 kHz, a 51.2 kS/s sampling rate is the standard. For shock measurements or high-frequency structural acoustics above 20 kHz, 102.4 kS/s or higher is needed. For rotating machinery fault detection, 20 kS/s is usually sufficient for bearing defect frequencies up to several kHz. How does channel isolation prevent ground loops? When multiple accelerometers are attached to a metallic structure and their cable shields all connect back to the same DAQ ground, any potential difference between measurement points creates a current loop through the shield. This current appears as a low-frequency noise signal — typically 50/60 Hz mains hum or its harmonics. Per-channel galvanic isolation breaks this loop by floating each channel's ground independently from the chassis and from other channels. The result is a clean measurement even when sensors are distributed across a large electrically complex structure. What is the difference between simultaneous and multiplexed sampling? Multiplexed sampling uses a single ADC that switches rapidly between channels. At 16 channels and 50 kS/s per channel, the ADC must run at 800 kS/s, and each channel is sampled 1/800,000 of a second after the previous one. At 10 kHz, this 1.25 µs delay corresponds to a 4.5° phase error between adjacent channels — significant enough to corrupt modal analysis results. Simultaneous sampling uses one ADC per channel (or per pair of channels), so all channels are sampled at exactly the same instant. For any measurement where phase accuracy matters, simultaneous sampling is required. Can I combine acoustic and vibration channels in the same acquisition? Yes, and for most NVH and acoustic diagnostics this is exactly what is required. Microphones (condenser, IEPE-powered) and accelerometers both connect via IEPE-compatible inputs and can be mixed freely within the same acquisition session. The synchronised acquisition of sound and vibration data enables direct calculation of acoustic intensity, sound power, and frequency response functions between structural inputs and acoustic outputs — the foundation of transfer path analysis. → See SonoDAQ Pro specifications | Request a demo for your application
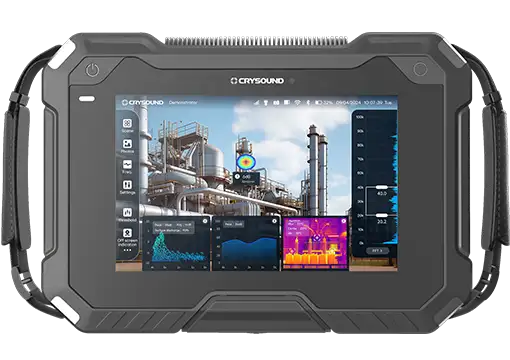
An acoustic camera is one of the most powerful tools available to engineers who need to locate, visualize, and quantify noise sources in complex environments. Whether you are troubleshooting an unwanted rattle inside a vehicle cabin, tracking down air leaks in a compressed-air system, or verifying the acoustic performance of a home appliance on the production line, an acoustic camera can do in minutes what traditional measurement methods take hours—or fail to do at all. This complete guide explains how acoustic cameras work, where they are used, what to look for when choosing one, and how they compare to conventional sound level meters. By the end, you will have a clear understanding of sound source localization technology and the confidence to select the right acoustic imaging camera for your application. What Is an Acoustic Camera? An acoustic camera is an instrument that combines a microphone array with a digital camera to produce a real-time visual map of sound—often called an acoustic image or sound map. The colored overlay shows exactly where noise is coming from, its relative intensity, and how it changes over time or frequency. Unlike a single microphone, which can measure sound pressure at one point but cannot tell you where the sound originates, an acoustic camera performs noise source identification across a wide field of view simultaneously. Core Components Component Role Microphone array Captures sound at multiple spatial positions Digital camera Provides the optical reference image Data acquisition hardware Digitizes and synchronizes all microphone channels Beamforming software Computes the sound map from array data How Does an Acoustic Camera Work? The Beamforming Principle The physics behind an acoustic camera relies on a technique called beamforming. Here is a simplified explanation: Sound waves arrive at the microphone array. Because microphones are at different positions, the same wavefront reaches each microphone at a slightly different time. Time delays are calculated. For every candidate point in the measurement space, the software calculates the expected arrival-time differences across all microphones. Signals are shifted and summed. The software shifts each microphone signal by the predicted delay and sums them. If the candidate point is the true source, the signals add constructively, producing a strong peak. If not, they partially cancel. A sound map is generated. By scanning thousands of candidate points, the algorithm builds a 2D (or 3D) color map of acoustic intensity overlaid on the camera image. This process is called delay-and-sum beamforming and is the foundation of most acoustic cameras. More advanced algorithms—such as CLEAN-SC, functional beamforming, and deconvolution approaches—further sharpen the image and improve dynamic range. Frequency Range and Array Design The usable frequency range of an acoustic camera depends on the array geometry: Low-frequency limit is governed by the overall array diameter. A larger array resolves lower frequencies. High-frequency limit is governed by the spacing between adjacent microphones. Closer spacing avoids spatial aliasing at higher frequencies. Typical acoustic cameras cover 200 Hz to 12 kHz or wider, with some specialized arrays reaching above 20 kHz for applications like leak detection. Applications of Acoustic Cameras Automotive NVH (Noise, Vibration, and Harshness) Acoustic cameras are indispensable in automotive development. Engineers use them to: Identify wind noise sources around door seals, mirrors, and A-pillars in wind-tunnel tests. Locate interior noise paths—dashboard rattles, HVAC duct noise, powertrain radiation—during road tests. Validate pass-by noise levels under ISO 362 by mapping exterior noise sources in real time. Home Appliance Noise Reduction Consumer expectations for quiet appliances are rising. Manufacturers of washing machines, refrigerators, dishwashers, and air conditioners use acoustic cameras to: Compare noise signatures before and after design changes. Detect abnormal noise patterns in end-of-line (EOL) quality checks. Pinpoint noise from specific subcomponents (compressors, fans, pumps) within a fully assembled product. Industrial Equipment and Predictive Maintenance In factories, acoustic cameras quickly identify: Compressed-air leaks, which account for 20–30% of energy waste in many plants. Bearing defects in motors, turbines, and conveyors—often before they become audible to the human ear. Electrical discharge (partial discharge) in high-voltage switchgear and transformers. Building Acoustics and Environmental Noise Acoustic cameras help building consultants identify sound transmission paths through walls, windows, and HVAC penetrations, verify the effectiveness of sound barriers, and map noise from construction sites. Power Generation and Renewable Energy Wind turbine manufacturers and operators use acoustic cameras to measure blade noise, detect trailing-edge damage, and comply with environmental noise limits. How to Choose an Acoustic Camera 1. Array Configuration and Size Planar arrays (flat) are the most common—lightweight, portable, and suitable for front-facing measurements. Spherical or 3D arrays capture sound from all directions for interior cabin or room acoustic studies. Number of microphones: More microphones improve spatial resolution and dynamic range. Entry-level: 30–64; high-performance: 100–200+. 2. Frequency Range Application Typical Frequency Range Automotive NVH (interior) 200 Hz – 8 kHz Appliance noise 300 Hz – 12 kHz Air leak detection 2 kHz – 20 kHz+ Building acoustics 100 Hz – 5 kHz 3. Software Capabilities Real-time beamforming, advanced algorithms (CLEAN-SC, deconvolution), time-domain and frequency-domain analysis, video recording with synchronized audio, and flexible export formats. 4. Portability and Ease of Use For field measurements, a lightweight, battery-powered, single-person-operable system is essential. A Closer Look: CRYSOUND Acoustic Imaging Systems The CRY8124 is a large-format planar array with 200 MEMS microphones, optimized for high-resolution measurements in automotive NVH and industrial applications. The CRY2623 is a compact, handheld acoustic camera with 128 microphones designed for rapid field inspections—air leak detection, electrical inspection, and predictive maintenance. Both systems include real-time beamforming software with CLEAN-SC deconvolution, video overlay, and spectral analysis. Acoustic Camera vs. Sound Level Meter: When to Use Which Criterion Sound Level Meter Acoustic Camera What it measures Sound pressure level at one point Sound source location and relative level across a surface Source identification No Yes—visual map shows source locations Regulatory compliance Yes—traceable dB(A)/dB(C) values per IEC 61672 Limited Cost $500–$5,000 $15,000–$150,000+ Best for SPL measurement, noise monitoring, compliance Root-cause analysis, noise reduction, leak detection In practice, the two tools are complementary. A sound level meter confirms how loud a problem is; an acoustic camera shows where it is. Conclusion Acoustic cameras have transformed the way engineers approach noise problems. By making sound visible, they accelerate root-cause analysis, reduce development cycles, and enable quality controls that were previously impractical. Ready to see your noise sources? Contact CRYSOUND for a personalized consultation or request a live demo with your application.
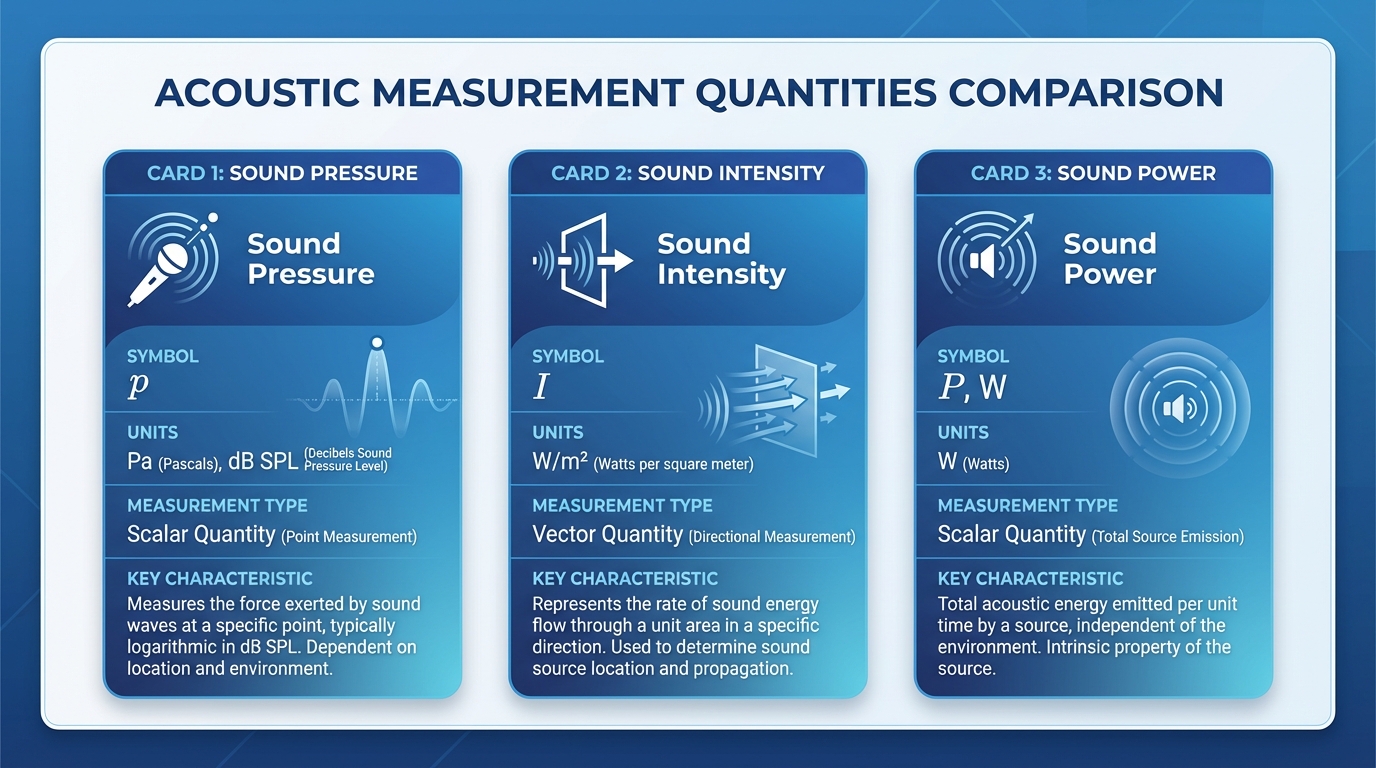
Sound pressure level, sound intensity, and sound power are three fundamental quantities in acoustic measurement, yet they are routinely confused—even by experienced engineers. This guide explains what each quantity physically represents, how they relate to each other, how to measure them according to international standards, and—most importantly—when to use which one in real engineering practice. The Three Quantities at a Glance Quantity Symbol Unit What It Describes Depends on Environment? Sound Pressure p (level: Lp) Pa (dB re 20 µPa) Force per unit area at a point Yes Sound Intensity I (level: LI) W/m² (dB re 1 pW/m²) Energy flow per unit area in a direction Partially Sound Power W (level: LW) W (dB re 1 pW) Total acoustic energy radiated by a source No The key distinction: sound pressure and intensity depend on where you measure; sound power is an intrinsic property of the source. Sound Pressure: What You Hear Sound pressure is the local fluctuation in air pressure caused by a sound wave. Sound pressure level (SPL) is expressed as: Lp = 20 × log₁₀(p / p₀) where p₀ = 20 µPa is the reference pressure. Key characteristics: Scalar quantity, location-dependent, easy to measure with a single calibrated microphone. When to use: Noise exposure assessment (ISO 9612), environmental noise monitoring, product noise labeling, quick field checks. Sound Intensity: Energy Flow with Direction Sound intensity is the rate of acoustic energy flow through a unit area in a specified direction—a vector quantity with both magnitude and direction. Key characteristics: Directional, less sensitive to background noise, requires specialized two-microphone probe. When to use: Sound power determination in situ (ISO 9614), noise path identification, transmission loss testing. Sound Power: The Source’s Intrinsic Noise Rating Sound power is the total acoustic energy radiated by a source per unit time—independent of environment. When to use: Product noise specifications (EU Machinery Directive), noise prediction and modeling, procurement and tendering. Measurement Methods and ISO Standards Sound Power via Sound Pressure (ISO 3741–3747) Standard Environment Accuracy ISO 3741 Reverberation room Precision (Grade 1) ISO 3744 Free field over reflecting plane Engineering (Grade 2) ISO 3745 Anechoic / hemi-anechoic room Precision (Grade 1) ISO 3746 In situ (any environment) Survey (Grade 3) Sound Power via Sound Intensity (ISO 9614 series) The advantage of the intensity method is its tolerance of background noise and reflections. Measurement Equipment CRYSOUND’s multi-channel data acquisition range includes prepolarized and externally polarized models in 1/2-inch and 1/4-inch formats, covering frequency ranges from 3 Hz to over 100 kHz. CRYSOUND’s data acquisition platforms support intensity measurement with real-time cross-spectral analysis across all channels. Practical Decision Guide: Which Quantity Do You Need? “I need to check workplace noise regulations.” → Measure sound pressure level per ISO 9612. “I need to compare noise output of two machines.” → Request or measure sound power level. “I need to find where noise leaks through a wall.” → Measure sound intensity on the receiving side. “I need to predict how loud a new machine will be.” → Get the machine’s sound power level, then model. “I need to meet the EU Machinery Directive.” → Determine sound power level per ISO 3744/3746. Summary Table Sound Pressure Level Sound Intensity Level Sound Power Level Quantity type Scalar Vector Scalar Depends on distance Yes Yes No Depends on room Yes Partially No Primary instrument Sound level meter Intensity probe Calculated from SPL or intensity Key standards IEC 61672 ISO 9614 ISO 3741–3747 Best for Exposure, compliance Path analysis, in-situ power Source comparison, prediction Conclusion Sound pressure tells you how loud it is here. Sound intensity tells you how much energy is flowing that way. Sound power tells you how much noise the source makes, period. By understanding these distinctions and selecting the right measurement method, you avoid costly errors and arrive at actionable acoustic data faster. Need help selecting the right acoustic measurement equipment? Contact CRYSOUND to discuss your application with our acoustics team.
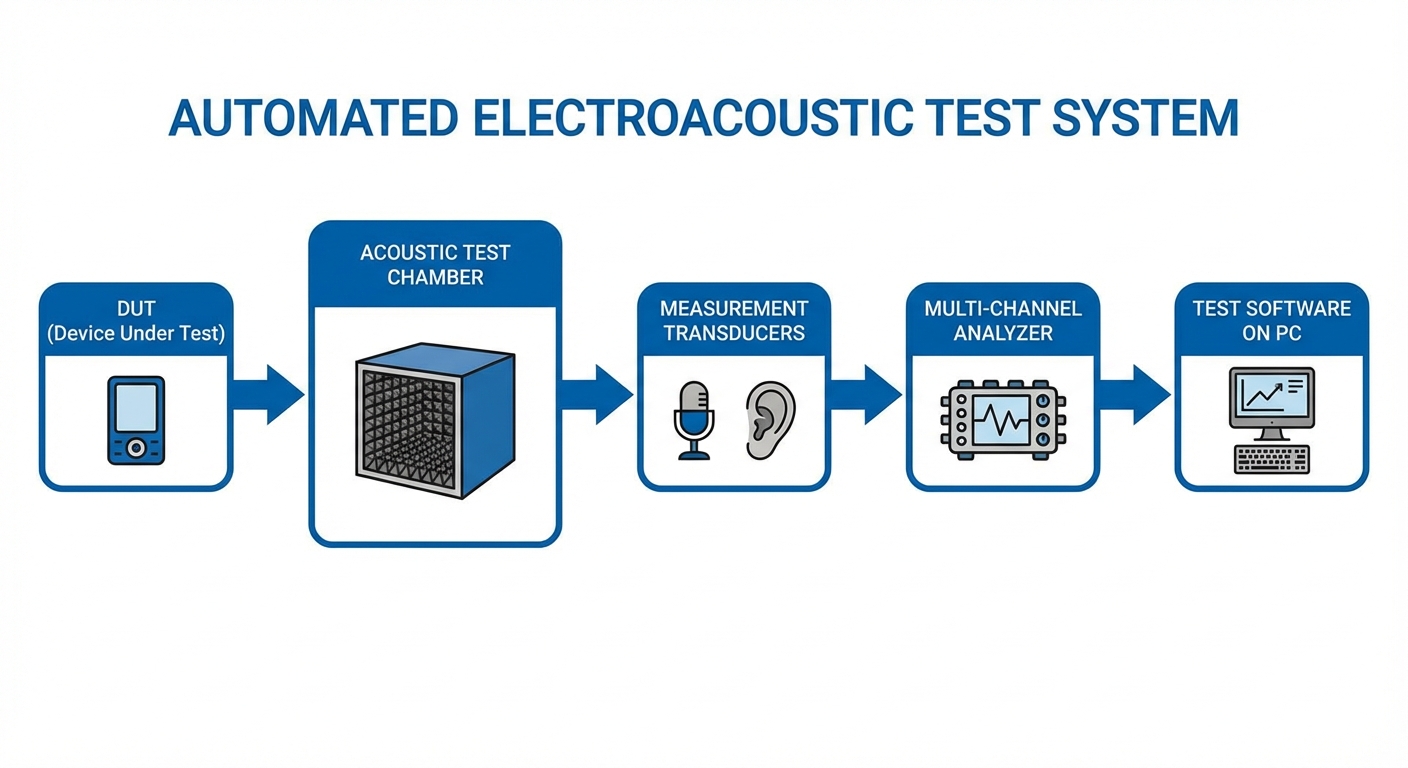
Every speaker, microphone, headphone, and hearing aid that leaves a production line must meet precise acoustic specifications. This guide walks you through the transition from manual electroacoustic testing to a fully automated audio test system. Why Automate? Manual Testing vs. Automated Testing The Manual Approach A typical manual setup consists of a signal generator, power amplifier, measurement microphone, audio analyzer, and an operator who connects the DUT, triggers each measurement, reads results, and records pass/fail. Limitations: Slow (2–5 min/unit), operator-dependent, error-prone, difficult to scale. The Automated Approach Factor Manual Automated Test time per unit 2–5 minutes 5–15 seconds Throughput 15–25 units/hour 200–500+ units/hour Repeatability Operator-dependent < 0.5 dB variation Data logging Manual/partial Automatic, 100% traceability Defect detection Subjective Algorithmic, consistent ROI is typically realized within 6–12 months for mid-volume production (>500 units/day). System Architecture: Hardware and Software 1. Signal Generation and Acquisition (Audio Analyzer) Modern audio analyzers integrate signal generation and acquisition in a single instrument with USB or Ethernet connectivity. 2. Acoustic Test Chamber (Test Fixture) The DUT must be tested in a controlled acoustic environment—anechoic coupler, semi-anechoic test chamber, or IEC 60318-compliant ear simulator. 3. Switching and Connectivity Relay matrix, barcode/QR scanner, PLC or I/O controller for conveyor systems and MES integration. 4. Test Software CRYSOUND's OpenTest platform provides a drag-and-drop test sequence editor, multi-station deployment, and built-in SPC dashboards. Key Electroacoustic Test Parameters Frequency Response: SPL vs. frequency curve evaluated against upper and lower limit masks Total Harmonic Distortion (THD): < 1% at 1 kHz rated power typical spec Rub and Buzz (R&B): Detects mechanical defects—loose particles, voice coil rub, rattling Impedance: Reveals resonant frequency, DC resistance, electrical behavior Polarity: Verifies correct phase direction Sensitivity: SPL at reference distance for given input Seal and Leak Test: For enclosed products Step-by-Step: Building Your Automated Test Line Define Test Requirements — List every parameter, pass/fail limits, cycle time, and applicable standards. Design the Test Station Layout — Calculate station count, inline vs. offline, one-sided vs. multi-sided. Select and Procure Equipment — Audio analyzer, microphones, test chamber, switching hardware, software. Build and Integrate — Assemble fixtures, wire signal paths, install software, connect PLC/MES. Establish Golden Unit Calibration — Select 5–10 reference units, define reference curves and repeatability baseline. Validate and Fine-Tune Limits — Run pilot batch of 100–500 units, analyze yield, adjust thresholds. Train Operators and Launch — Document procedures, go live with full data logging. Continuous Improvement — Daily calibration verification, SPC monitoring, periodic microphone recalibration. Common Pitfalls and How to Avoid Them Inadequate Acoustic Isolation: Design chamber for ≥30 dB insertion loss. Over-Tight Limits at Launch: Use pilot-batch statistics (mean ± 3σ). Ignoring Fixture Repeatability: Use positive-location fixtures, verify with gauge R&R. No Reference Unit Tracking: Measure reference unit at start of each shift. Conclusion Transitioning from manual to automated electroacoustic testing pays for itself through higher throughput, better repeatability, and comprehensive data traceability. The acoustic quality your customers hear is only as good as the test system that verified it. Ready to automate your electroacoustic test line? Contact CRYSOUND to discuss your production testing requirements. From audio analyzers and measurement microphones to the OpenTest software platform, CRYSOUND provides end-to-end solutions for production line audio testing.


